Events
SpotTrack: Award for Design Excellence
Every year The Norwegian Design Council / The Norwegian Centre for Design and Architecture acknowledges â€the very best of innovative solutions†through the annual Award for Design Excellence.
This year, SpotTrack, a product that I have been involved in designing, received one of the awards. SpotTrack is a laser-based reference system for relative positioning at sea, or, in plain words: a system that measures and tells you how far away you are from other ships and oil rigs.
SpotTrack has been developed by Kongsberg Seatex in collaboration with Halogen and Inventas. I worked on this product together with several other designers in Halogen. It is rewarding and fun to see that our efforts have resulted in a product that both the customers and the designers appreciate!
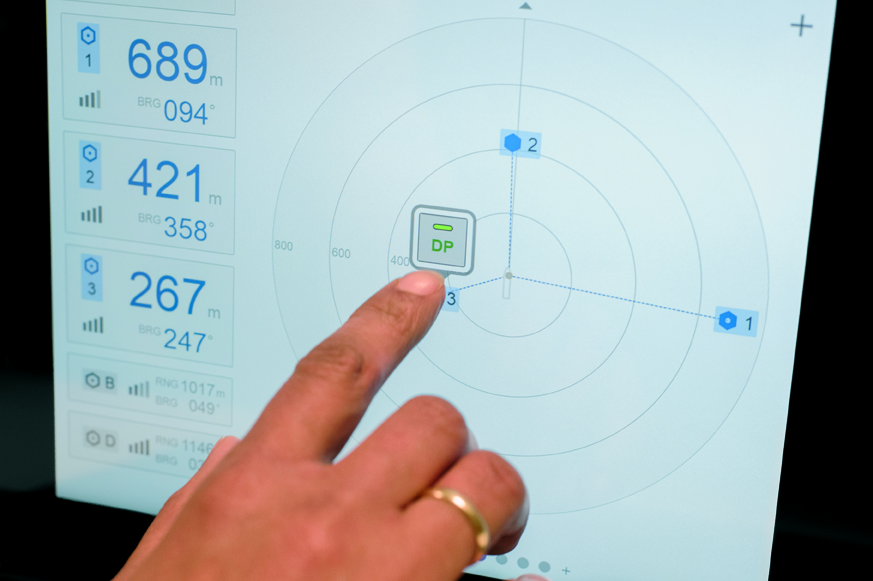
SpotTrack in use. Photo: Peder Torget
Story kicking big data
A couple of days ago I attended an event called That Time a Story Kicked Big Bad Data’s Ass. The event was hosted by GameChangers in the pool (!) of gangster gardener Ron Finley . Lucky for us, there was no water in the pool!
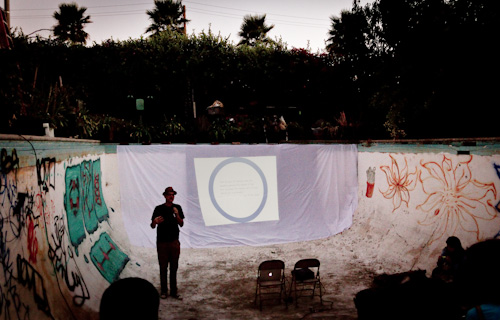
Mike Bonifer in Ron Finley’s pool
GameChangers is a consultancy company that use improvisation techniques and narrative design to help their clients improve their communication and develop brand strategies. Consequently, the event itself was filled with stories and improvisation, which was refreshing.
Infobesity – The Tyranni of Data
The topic of the night was the relationship between big data and stories. Even though it was made clear that we should embrace big data, the take home message was that we need stories to understand and communicate data, and that stories can achieve much that data can’t. The proliferation of big data and lack of stories results in ‘infobesity’.
Mike Bonifer pointed out that stories can create a vision for the future, while data can only show us a snapshot of the past. Stories are experienced in the present, and speak to our unconsciousness. Relating this to my own project, this inspires me to look for ways of integrating data visualization and stories on multiple levels: from visualizing stories, to stories of visualization.
The Tyranny of Stories
However, stories also have a darker side, which Mike referred to as ‘The tyranny of storiesâ€. People can be persuaded to buy into a story based on false premises, like signing up for a subprime mortgage, or to invade a country based on factual lies. Consequently, the power of stories makes them suitable for misuse, just like data and statistics can easily be misused.
Data visualization as a story space
Comparing big data with stories is, of course, somehow like comparing apples and oranges. I agree that data needs a story if you want to communicate something specific. However, in the context of data exploration and analysis, for example, you might want to visualize and present data without a tightly choreographed story. Such a visualization would allow the user to navigate and explore the data him/herself, and thereby create new, previously unknown stories. In that way, big data becomes a ‘story space’ in which a multiplicity of stories can reside.
Thanks to Mike and the rest of the GameChangers for an extraordinary event filled with stories to remember!
3,5 års arbeid på 6 minutt og 40 sekund
(In Norwegian only. English version underway)
For nokre veker sidan oppsummerte eg doktorgradsprosjektet mitt på 6 minutt og 40 sekund. Her ser du resultatet:
Denne presentasjonen vart laga for Pecha Kucha Night Oslo, som arrangerast med jamne mellomrom på DogA. Pecha Kucha skal vere ein inspirasjonskveld med lynforedrag om arkitektur, design og kunst. Kvar talar får ta med 20 bilete som kvart blir vist i 20 sekund, til saman 6 minutt og 40 sekund. Heldigvis fekk eg lov å bytte ut nokre av bileta med video – noko som var essensielt for å formidle arbeidet mitt.
Presentasjon: Skisser utanfor boksen
(Only in Norwegian)
Her er presentasjonen min frå RECORD-seminaret på AHO 10. september 2010. Her argumenterer eg mellom anna for at utforming av grensesnittet er svært viktig i sosiale medier, noko som sjeldan vert snakka høgt om. Vidare snakkar eg om fire ulike måtar å skisse bevegelse på: 1) ved å bruke video + papirprototyping, 2) stop motion, 3) digital animasjon og 4) kode. For meir informasjon, sjå artikkelen Connecting motional form to interface actions in web browsing.
Skisser utanfor boksen
Sidan det ikkje er video i presentasjonen ovanfor, legg eg ved alle videoskissene mine her. Dei er sorterte etter handling, og viser dermed ulike måtar å 1) lagre medieelement (bilete) til ei samling, 2) navigere mellom ulike medieelement, og 3) opne ei samling av medieelement. Skissene er laga ved bruk av video, stop motion og animasjon i After Effects.
1. Ulike måtar å lagre medieelement til ei samling:
2. Ulike måtar å navigere mellom medieelement:
3. Ulike måtar å opne ei samling av medieelement:
Presentation: Social Navimation
Yesterday I presented my paper on Social Navimation at the NORDES conference Engaging Artifacts. I used the online presentation tool Prezi to create the visual presentation, which includes videos of interfaces I have designed. The videos are also available at the Design page.
How to see the presentation: use the buttons in the lower right corner. The second button opens the presentation in full screen, while you push the button to the right to go further in the presentation.
Social Navimation is the phenomenon of engaging with social media through a navimational interface, or more specifically, to intertwine navigation with motion in
social media applications. In this paper I analyse a set of design examples of how social navimation can be realised.
I got a lot of positive comments after the presentation, especially on the visual presentation. Overall I am happy with the Prezi tool, even if I have discovered some bugs. It took me quite some time to make the presentation, but now I know the tool and will definitely use it for future presentations.
Search
Recent posts
- SpotTrack: Award for Design Excellence
- VizBox Bergen og årets geogründer
- Fulbright report: six months at the School of Cinematic Arts in Los Angeles
- The VizBox Experiments
- TopoBox: exploring a tangible dataviz platform
- Norway in 3D part I: from DEM to 3D surface
- Using visualization for understanding survey data
- Story kicking big data
- Fulbright project: Dynamic Information Visualization
- Visiting Fulbright scholar at USC in Los Angeles
- (E)motional design paper at DANDE2012
- 3,5 års arbeid på 6 minutt og 40 sekund
- PhD thesis online
- New video: Kinetic Interface Design
- Presentasjon: Skisser utanfor boksen