Norway in 3D part I: from DEM to 3D surface
Earlier this year the Norwegian Mapping Authority released a bunch of free data, including Digital Elevation Model (DEM) files that describe the terrain of Norway in high detail.
I wanted to use this data to create a 3D model of Norway that I eventually could 3D print. This turned out to be a bit complicated, so I want to share some of my experiences in case anyone else wants to do something similar. So yes, this will be a bit technical.
Getting the DEM files
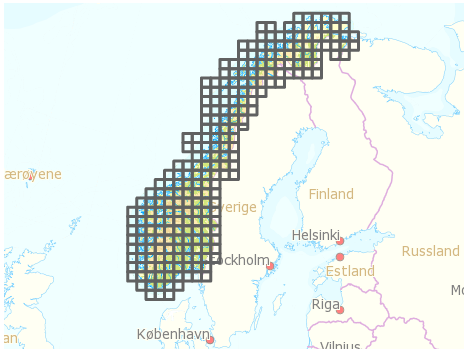
After registering and logging in to data.kartverket.no you are ready to download the files. But don’t think you get one file for the whole of Norway! First, you have to figure out which files to download (I used ‘Digital terrengmodell 10 m , UTM 33’), and then select and download 254 individual files one by one to get all the tiles you need.
Merging the tiles
So, now you have a lot of DEM files that you need to combine into one large file. I installed GDAL, which is an open source and powerful “translator library for raster geospatial data formatsâ€. The library is used by various software packages, and can also be used with shell scripts. After quite a lot of googling and trial and error I managed to write a shell script that combined all the DEM files into one GeoTIFF file. The script:
#!/bin/bash
gdal_merge.py -ps 100 100 -init 255 -o merged.tif *.dem
-ps 100 100 specifies the resolution for the output file. Higher number: smaller output file.
-init 255 specifies color range.
-o merged.tif specifies the output file.
*.dem uses all the DEM files in the current folder as input.
See full gdal_merge documentation for more.
GeoTIFF files are similar to regular TIFF images, but they store a lot of additional geospatial data. You may open the file in Photoshop, but you will probably just see some basic black and white contours.
Create heightmap
One of the simplest ways to create a landscape in 3D is to use a greyscale heightmap, and displace a surface according to the image. A heightmap is basically just an image in which color represents height, from low (black) to high (white). There are probably other more sophisticated ways of creating a 3D surface, but this is at least quite straightforward.
First, it is necessary to create a greyscale heightmap from the GeoTIFF file. This shell script did the trick:
#!/bin/bash
gdal_translate -b 1 -scale -20 2500 -of PNG merged.tif heightmap.png
-b 1 select input band 1 (don’t even ask me).
-scale -20 2500 set height/color range from -20 m (black) to 2500 m (white).
-of PNG specify output file format.
merged.tif input filename.
heightmap.png output filename.
See full gdal_translate documentation
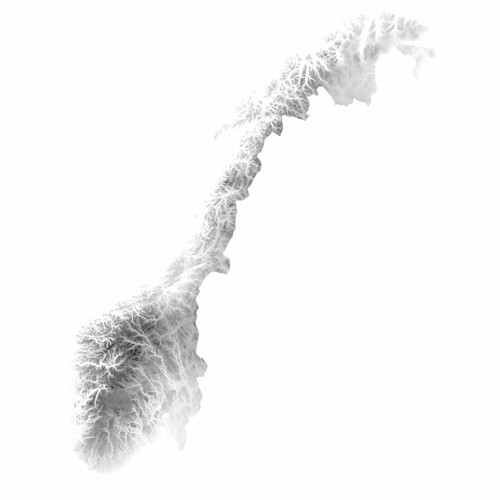
The result is a greyscale map that looks like this:
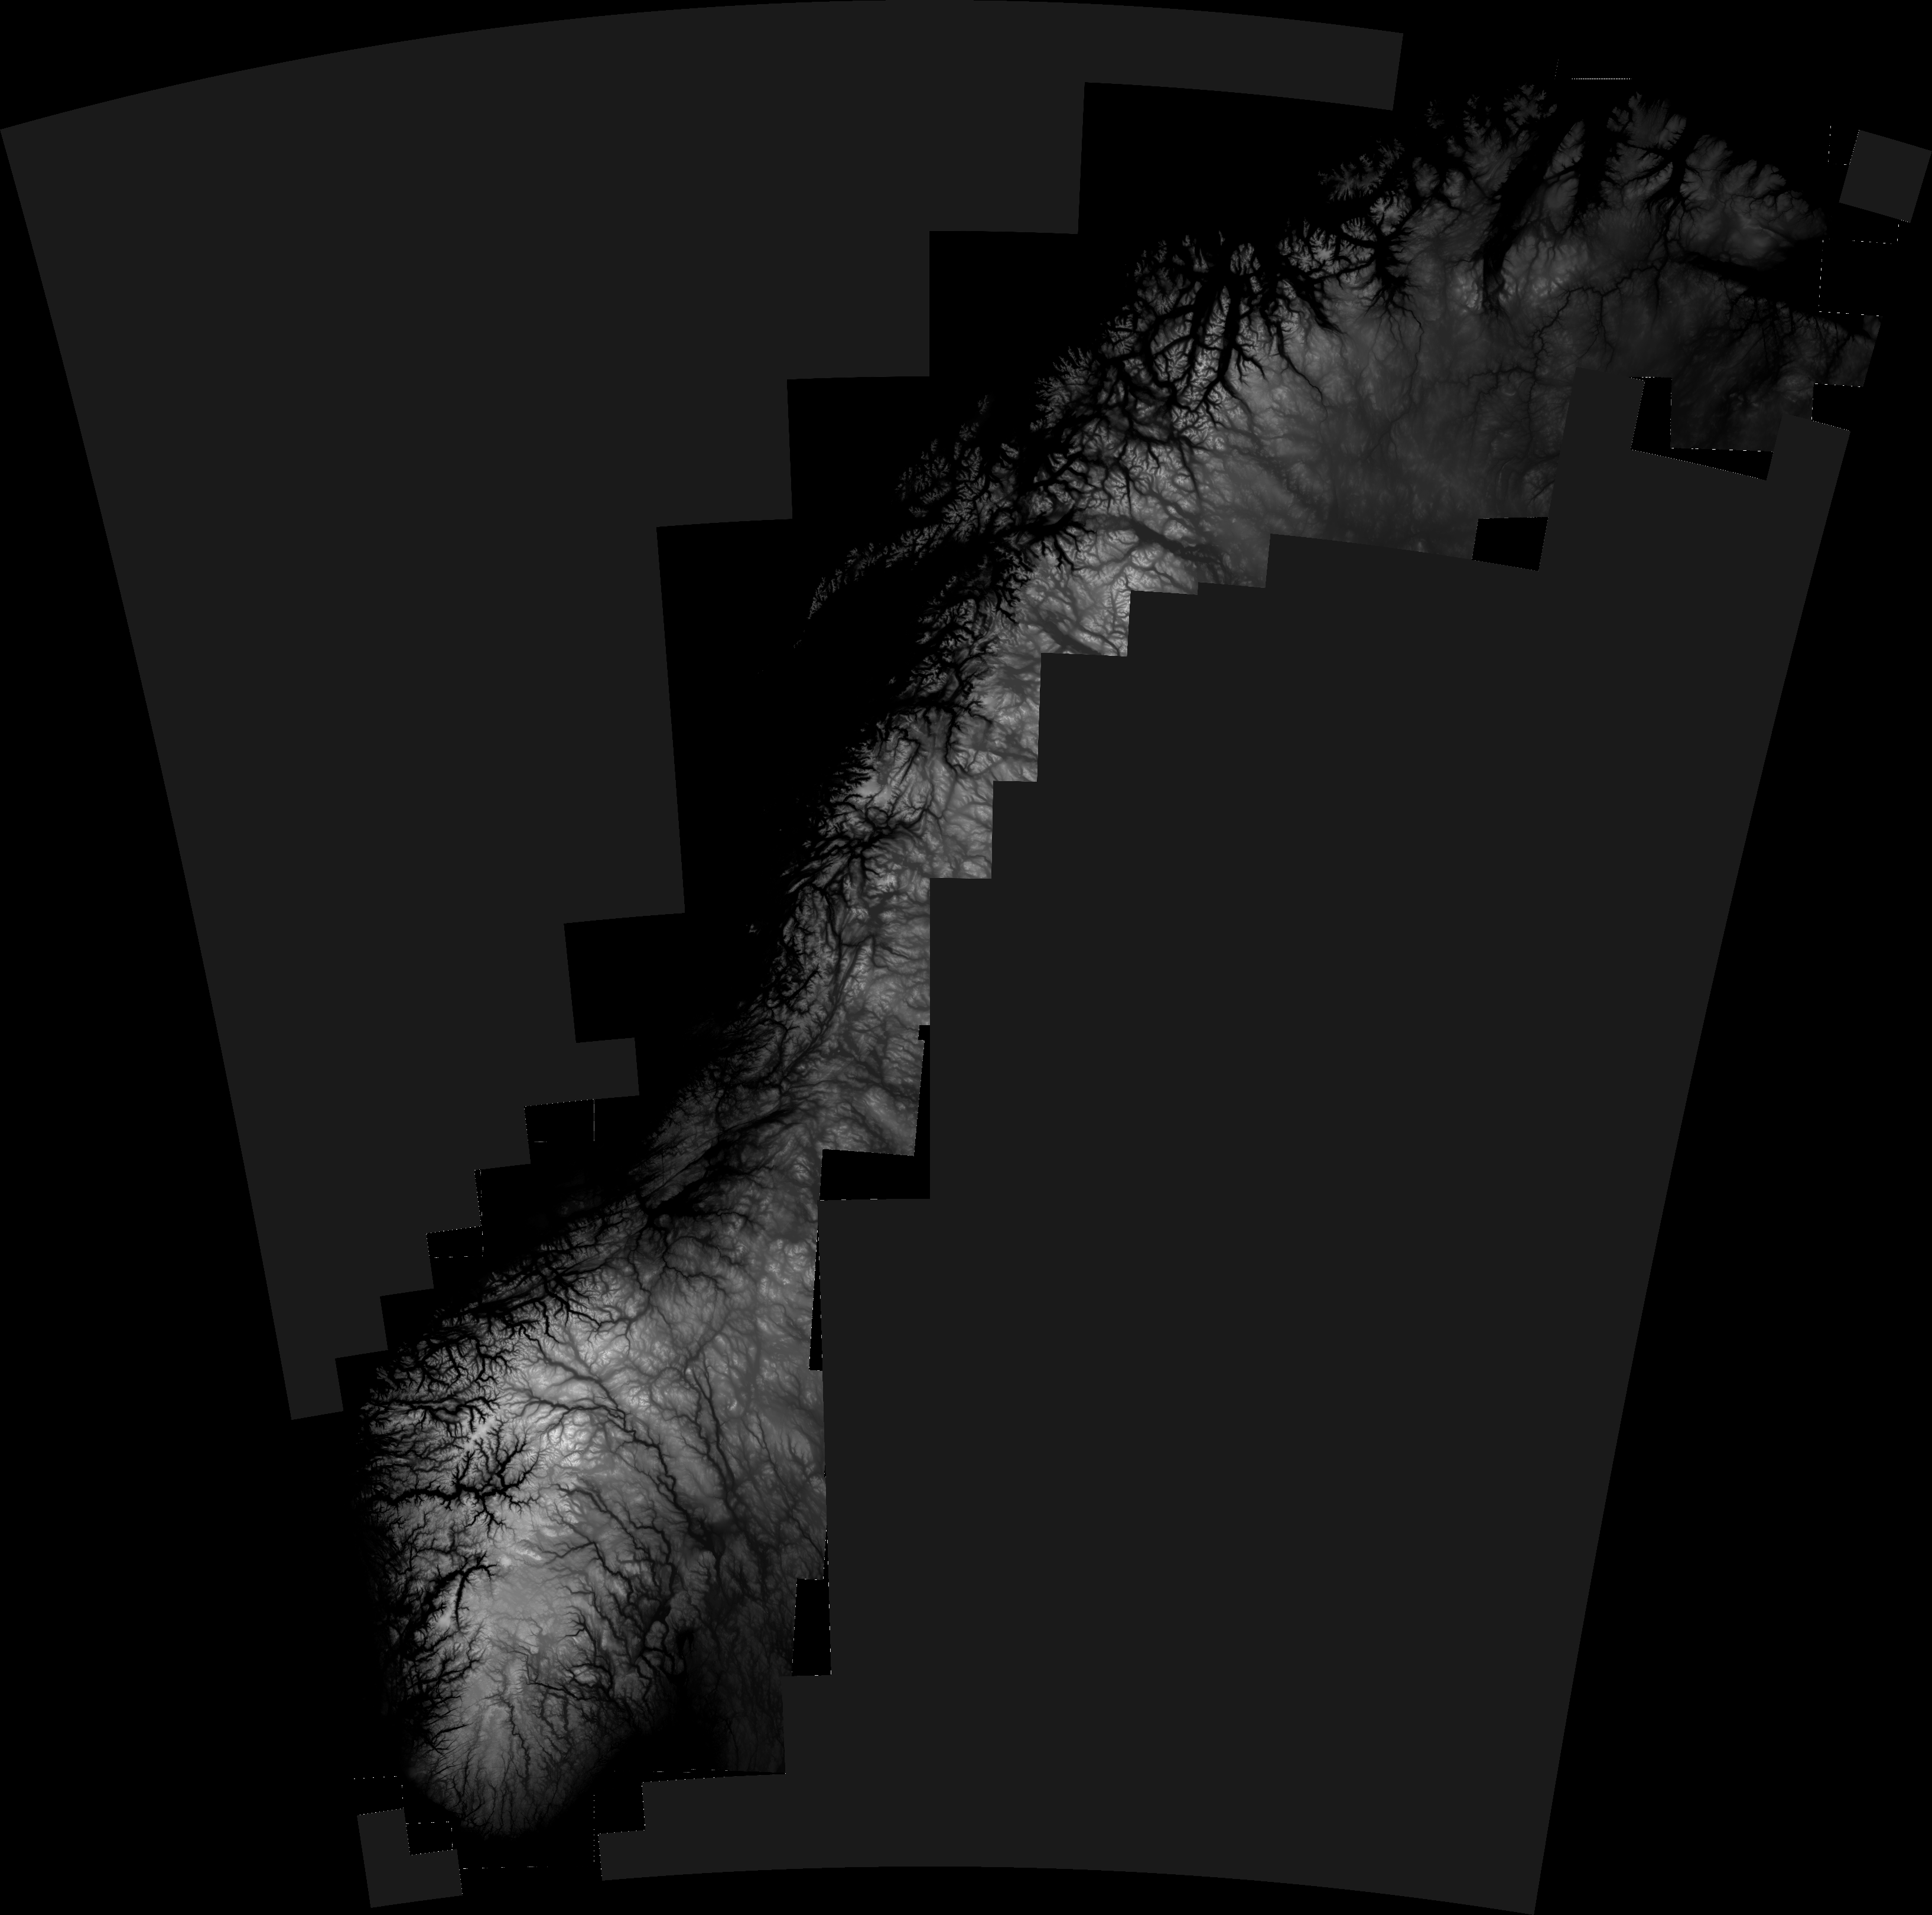
As you may see, parts of Sweeden have been included in this image. We can’t have that, of course, so I removed the Sweedish areas by applying a mask in Photoshop. Here is the final heightmap (click to see larger version on Flickr):
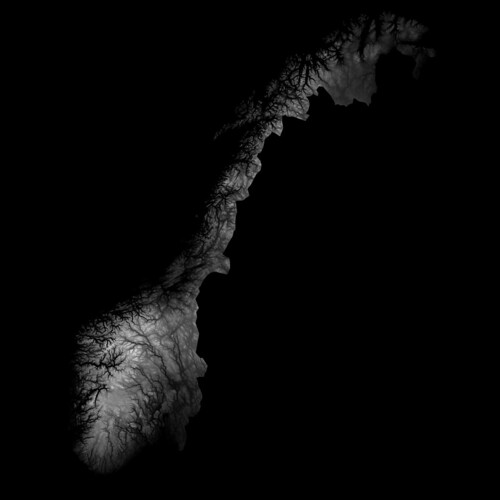
By the way, it looks even cooler with inverted colors, don’t you think? The fjords and the mountains look like veins in some kind of alien organism..
Create 3D surface in Blender
A lot of 3D applications can create 3D surfaces from heightmaps. Since I am trying to use open source software as much as I can, I wanted to use Blender, and for this purpose it worked quite well. (The capabilities of Blender are impressive, but is unfortunately quite hard to use due to a range of usability issues, even though they did a major UI facelift a couple of years ago.)
Creating a 3D surface from a heightmap goes something like this:
- Create a plane
- Go to edit mode (Tab), and subdivide the plane (W). More subdivisions will give you more detail, but also a very heavy model.
- Go back to object mode, add new material to the plane
- Add new texture to the place, and select “Image or movie†as input. Load the heightmap image
- Add a Displacement modifier to the plane, using the texture as input. Adjust the strength to adjust how much the surface should be displaced
And voilà ! You have Norway as a 3D surface. Add some light, and you get something like this:
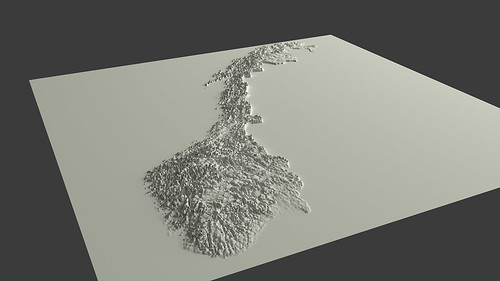
You can probably see that I have exaggerated the height a lot in this particular model. Otherwise it would probably be hard to see any landscape at all.
Actually, when I look at it, I find this to be an interesting visualization in itself; by exaggerating the height, it is possible to get an impression of the topography of different areas of Norway in one picture, which otherwise would be impossible to achieve.
Wouldn’t it be cool to 3D print this? Oh yes, I’ll get back to that. And why I wish the earth was flat.
Using visualization for understanding survey data
One of the goals for my Fulbright project has been to work with real data, and use visualization as a means of exploring, understanding and analyzing data.
When doing research on data visualization it is obviously necessary to have some data to work with. Before going to the US I decided to cooperate with Difi (The Agency for Public Management and eGovernment) in Norway, since I had positive experiences from working with them before, and they were more than happy to see someone use their data.
More specifically, I have been working with survey data from The Norwegian Citizen Survey (Innbyggerundersøkelsen), which asked 30.000 Norwegians about their perceptions of public services in Norway, the welfare state and democracy, and living in different parts of Norway.
I have carried out a range of visualization experiments in order to get to know the data, but also for testing different visualization techniques as tools for discovery and analysis. Some of these visualization experiments will be presented in this blogpost, along with some of the lessons I have learned on the way.
Gigamapping the survey
One of the challenges when facing a large dataset is to understand the context in which it has been created. How was the data gathered? What can the data tell us, and more importantly, what can it not tell us? Are there any specific issues that are important to be aware of when analyzing and presenting the data?
Before leaving Norway, I had a meeting with the people in Difi that are responsible for the survey. While discussing the survey, I made notes on a large canvas laid out on the table, which served as a medium for documentation as well as a shared platform for discussion during the meeting. The resulting sketch was messy and kind of ugly (as expected!), but served its purpose well.
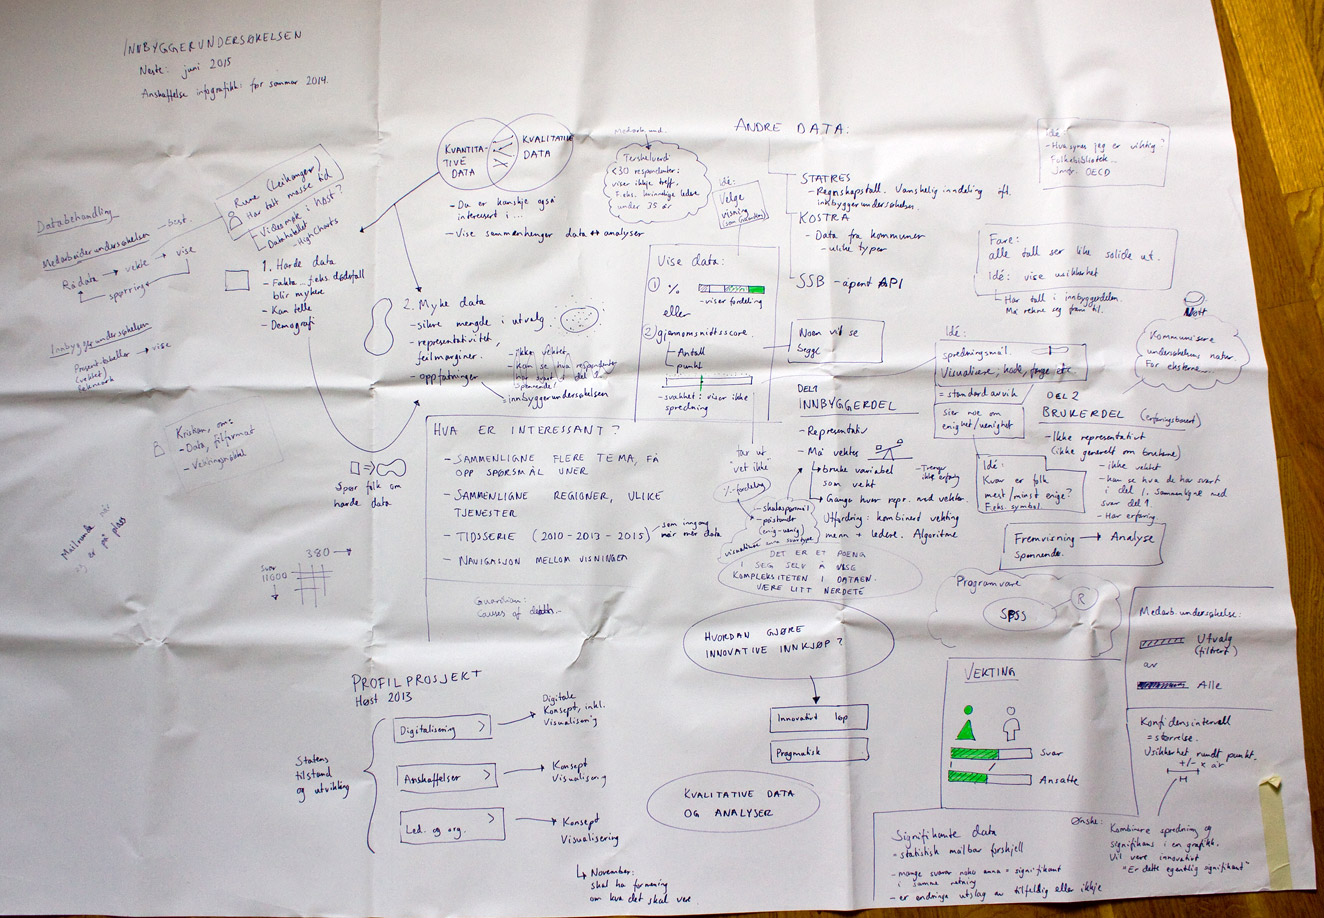
Sketch from meeting with Difi. Click to see larger image.
When I got to the US I digitized and cleaned up the map, and added some more relevant information. The result is a visual overview, or gigamap, that maps out different aspects of the survey and the data, and also serves as a medium for discussing the project with Difi and others. For me, the process of making the map was probably as important as the resulting map itself, as this forced me to clarify and reflect on the information, and look deeper into areas that I didn’t know enough about (like relevant concept from statistics).
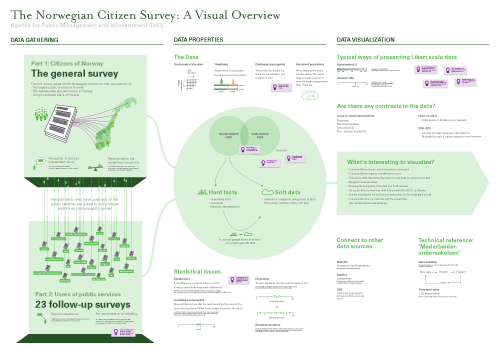
Digitized and cleaned gigamap. Click to download map in PDF format (1.6 MB). Feel free to print it out and put it on the wall, like I did!
I have put the final map on the wall in my office to remind myself of all the aspects of the survey, as well as make my project visible to my colleagues. In addition, it has been useful to show the map in presentations, and literally zoom into specific areas of interest.
Lesson learned: Visualization and gigamapping can be useful for gathering, processing and communicating information about the context in which a specific dataset has been created. One of the main challenges is to find the balance between complexity and simplicity, between visualization as a tool for thinking and visualization as a tool for communication.
10,039,380 data points
After my initial meeting with Difi, it was time to get to know the data. When I have visualized data before I have mostly worked with aggregated data that has already been processed. In this case, however, I wanted to work with raw data in order to get more control and better understanding of the data.
The survey data comes in a large spreadsheet format in which each respondent’s answers are located in a row, and each column represents an answer to a question (or data about the respondent). For just part 1 of the survey there are 23790 rows and 422 columns, which results in 10,039,380 cells! Where to begin?
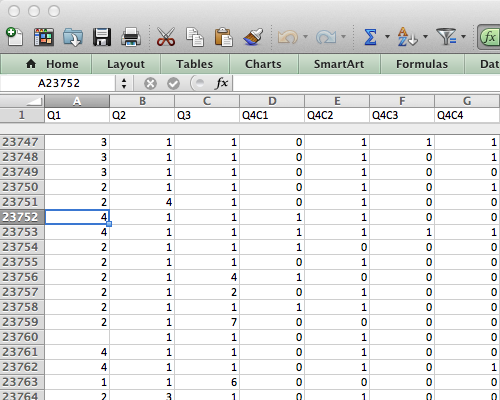
Screenshot from Excel
Lessons learned: it can be quite overwhelming to approach a large dataset for the first time. Even though working with ‘raw data’ has its advantages in terms of pliability, it requires specific knowledge and skills to approach it efficiently.
First attempts: Tableau Public
My first attempts for working with the data were done with Tableau Public, the free version of Tableau Software.
Tableau Software is an application designed specifically for data visualization, and provides an (seemingly) easy-to-use interface. Unfortunately Tableau only runs on PCs, so I had to install Windows on my Mac to try it out. (A Mac version of Tableau Public is coming out in 2014).
I have the impression that many dataviz designers use the software for discovery, so I wanted to give it a try. However, I found that the type of data I work with (survey data that should be weighted) was hard to get into Tableau. Finally, I managed to get some of the data in, and I was able to gain some insight from the resulting visualizations. For example, I found that people in Norway are overall satisfied with their life situation – which of course is a good thing, but not so interesting to visualize!
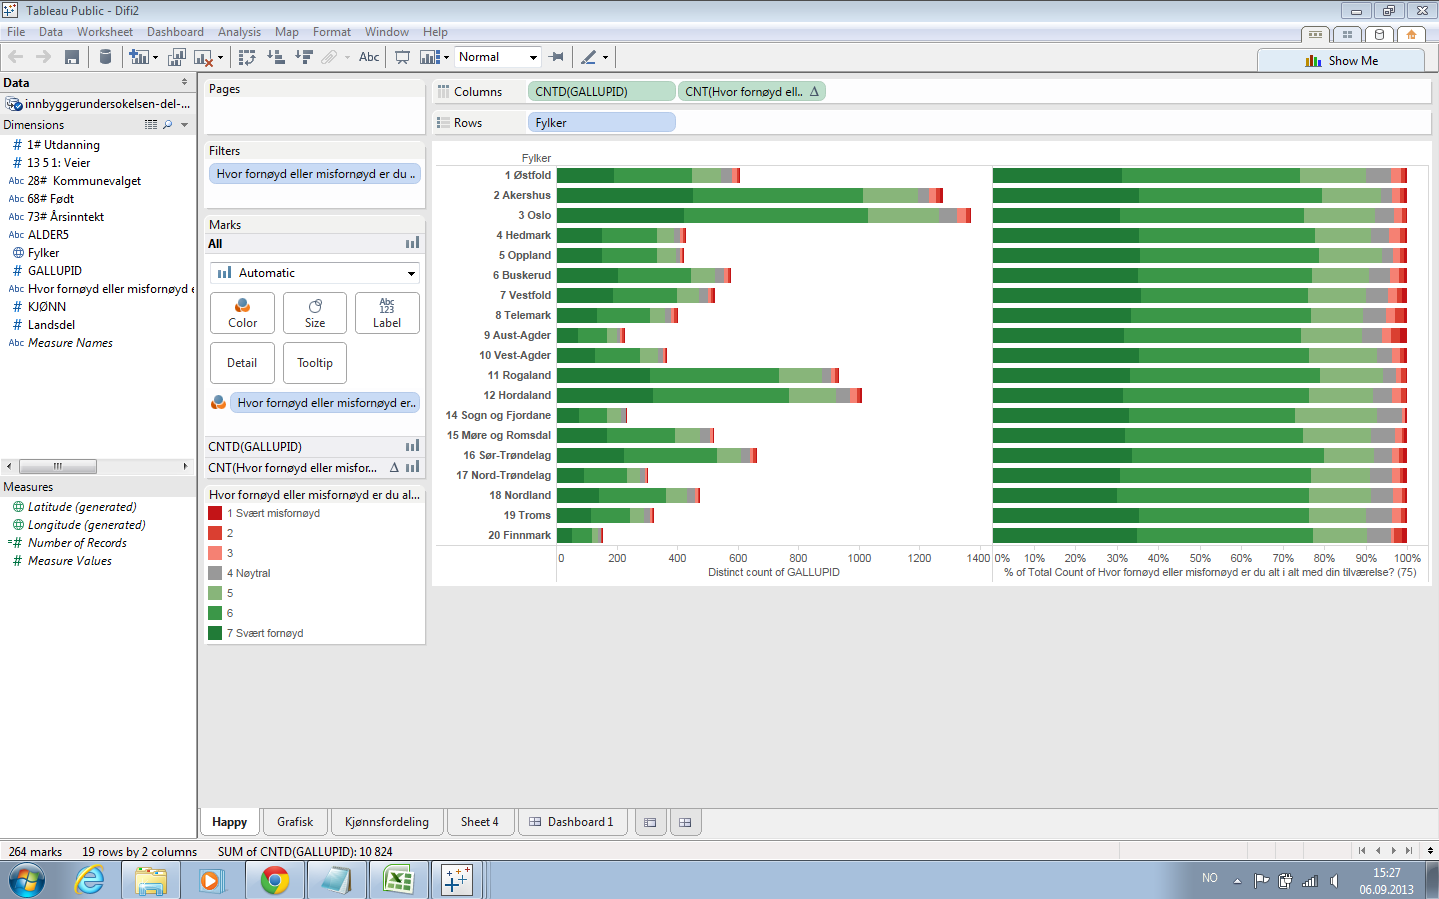
Screenshot from Tableau Public. Click to see larger image.
Lesson learned: the good and bad thing with tools like Tableau is that the software presents you with a limited set of visualization types. This is useful if you need a standard graph, but Tableau is not the software package you would choose for exploring new kinds of data visualization. In addition, Tableau seems to live in its own little bubble; you have to work with the presets, interface styles and export formats presented to you. I needed something more flexible, and didn’t want to spend a lot of time learning to use an application that could only take me so far.
Going behind the scenes with Python
While struggling to get my data into Tableu, I realized that I needed to learn some new tools to be able to sort and rearrange data. In addition, I wanted to combine several datasets into a new one, and for that purpose I needed to do some scripting.
Inspired by Nathan Yao, I decided to learn Python, which runs in the Terminal, and is powerful for working with large datasets. Python is also useful for scraping websites for data, which might come in handy later. If you want to learn Python, I highly recommend CodeAcademy. But be warned: you might get addicted to its game-like learning environment! I did.
Lesson learned: preparing, sorting, merging and rearranging data is a necessary but time consuming part of the data visualization process. Even though a couple of lines of code might be enough, the challenge is to find out exactly what those lines should contain. I am convinced that dataviz designers should learn at least some programming.
Categorical data overview with dbcounter
Since I started working with the survey data, I was looking for a way to get an overview of all the data. The solution was a Nodebox script written by Moritz Stefaner, that quickly makes a visual overview of large sets of categorical data (like survey data). I downloaded Nodebox and the script (which is written in Python), and tweaked it a bit. I saved the resulting illustration as a PDF, and changed the colors and fixed the text in Illustrator.
Each row shows the distribution of the responses for each question in the survey. Next to the graphic I put all the questions, so that I can zoom in and see the distribution and the corresponding question.
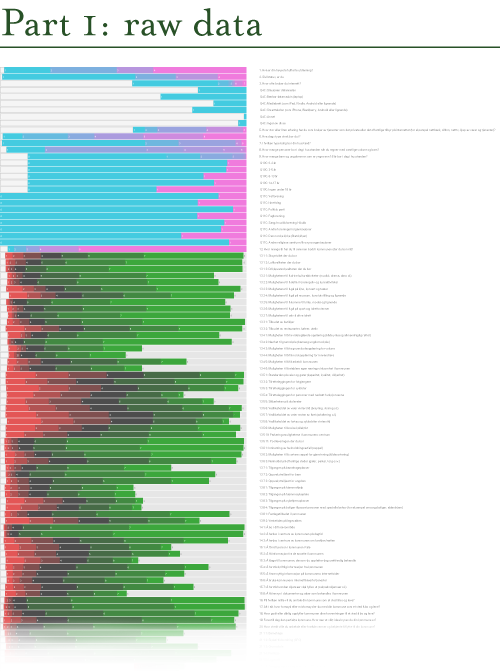
The image shows the top 15% of the visualization. Click to see the full visualization, PDF 1.1 MB
The nice thing with this visualization is that it is possible to see all the data at once. The responses that show a red to green gradient represent likert scale questions (disagree – agree, or very bad – very good). The pink-to-cyan gradients represent all other kinds of questions and variables, in which the categories are more arbitrary. Consequently, it is necessary to know the questions (and possible answers) in order to fully understand the visualization. This would not make much sense to present this for a general audience, but it works well for the purpose of discovery and exploration.
Lesson learned: dbcounter demonstrates how a simple script can be used to create a visualization that would take hours to produce manually. The resulting visualization allows us to see the distribution for all the questions at once, and makes it easier to discover interesting areas in the data, and start asking questions.
Explore interrelations with Parallel sets
While the dbcounter visualization gave a nice overview of the distribution of all the responses, it did not say anything about the interrelations across the questions/variables (also known as cross tabulation). One way of exploring such interrelations is to use an app called Parallel Sets, developed by Robert Kosara. The app makes it easy to interactively explore and analyze categorical data, and show relations between different categories.
The best way to explain this is through an example, using the survey data:
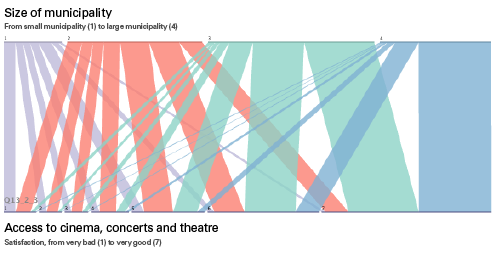
Image exported from Parallel Sets, with text added. Click to see larger image.
The horizontal line at the top shows the distribution of the size of the municipalities the respondents live in, from small municipalities (1) to large municipalities (4). The bottom line shows how satisfied people are with their access to cinema, concerts and theatre, from very unsatisfied (1) to very satisfied (7). Then, each respondent is tracked across the two variables, so that we can see what those who live in a small or large municipality feel about their access to cinema etc. As you might see, most people from large municipalities are very satisfied with the access, while the respondents from the small municipalities are not.
Lesson learned: even though it might be interesting enough to look at individual questions and responses, it becomes more interesting when we start to look for relations across variables. The Parallel Sets app provides one way of investigating such relations visually. However, it seems that this type of visualization works best when there are relatively few categories for each variable.
Searching for patterns in R
While dbcounter and Parallel Sets are great for visualizing data, they provide limited possibilities for analysis. At this point in the project, I was especially interested in correlation, and wanted to look for correlations between different variables in the dataset. For such statistical analysis, R is the place to go. R is a free, programming-based software environment for statistical computing. It can be used for visualizing data, even though the resulting graphs are a bit rough. However, by saving the graph as PDF and edit it in Illustrator, it is possible to make something decent out of it.
I have written some small and simple scripts in R in order to look for patterns in the data, reusing some code examples from Nathan Yau. The visualization type I found most useful was the Scatterplot matrix with LOESS curves. Here, the different variables are mapped against each other, plotting each respondent’s answer according to the two variables. Then, a LOESS curves is drawn horizontally, based on the averages of the variable on the vertical axis.
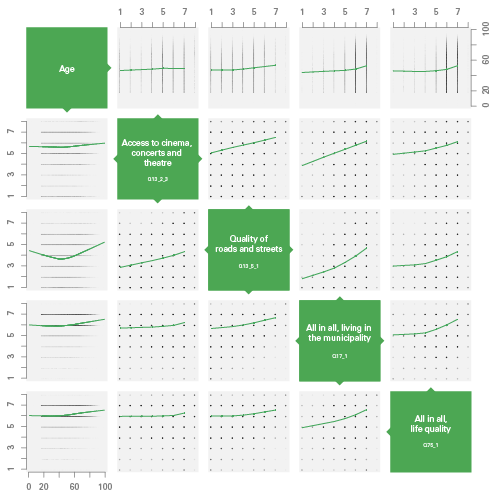
Scatterplot matrix. Click to see larger version (PDF).
In this example, you see the correlation between respondents’ age (top row and left column) and 4 questions. For example, in the left column, satisfaction is plotted vertically against age (horizontally). As you may see, older people seem to be slightly more satisfied than young ones, and young and old people are the ones most satisfied with the quality of roads and streets. In addition, we see that there is a strong correlation between the 4 questions: people who are satisfied with one topic are likely to be satisfied with something else as well.
Lessons learned: data analysis and statistical computing is highly useful and necessary for finding interesting patterns in a data set. As a designer, however, it is important to find the balance between doing statistical analysis and doing data visualization. Even though infoviz designers should know a bit about statistics, it may be more important to know how far our knowledge goes, and when we should talk to a professional statistician. Obviously, this also points to the need for multidisciplinary teams in data visualization projects.
Next up: concept development
To sum up, all the visualization examples presented here have been carried out in order to get to know the survey data, and test different visualization techniques for discovery and analysis. Looking back at all these experiments, I think the most important lesson has been to experience how many different ways it is possible to approach a survey dataset through visualization. There simply is not one type of visualization that can show everything; different types of visualizations provide different types of insights. This also points to the importance of data visualization in general: by visualizing our data in different ways, we see it through different lenses, and thereby learn something new about the data itself.
In parallel to these experiments, I have been working on different ideas for creating a more comprehensive concept for interactive data visualization. This is still very much a work in progress, so stay tuned!
Story kicking big data
A couple of days ago I attended an event called That Time a Story Kicked Big Bad Data’s Ass. The event was hosted by GameChangers in the pool (!) of gangster gardener Ron Finley . Lucky for us, there was no water in the pool!
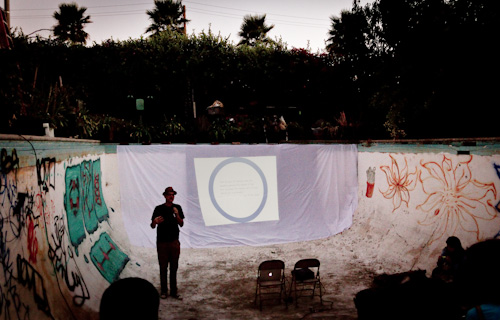
Mike Bonifer in Ron Finley’s pool
GameChangers is a consultancy company that use improvisation techniques and narrative design to help their clients improve their communication and develop brand strategies. Consequently, the event itself was filled with stories and improvisation, which was refreshing.
Infobesity – The Tyranni of Data
The topic of the night was the relationship between big data and stories. Even though it was made clear that we should embrace big data, the take home message was that we need stories to understand and communicate data, and that stories can achieve much that data can’t. The proliferation of big data and lack of stories results in ‘infobesity’.
Mike Bonifer pointed out that stories can create a vision for the future, while data can only show us a snapshot of the past. Stories are experienced in the present, and speak to our unconsciousness. Relating this to my own project, this inspires me to look for ways of integrating data visualization and stories on multiple levels: from visualizing stories, to stories of visualization.
The Tyranny of Stories
However, stories also have a darker side, which Mike referred to as ‘The tyranny of storiesâ€. People can be persuaded to buy into a story based on false premises, like signing up for a subprime mortgage, or to invade a country based on factual lies. Consequently, the power of stories makes them suitable for misuse, just like data and statistics can easily be misused.
Data visualization as a story space
Comparing big data with stories is, of course, somehow like comparing apples and oranges. I agree that data needs a story if you want to communicate something specific. However, in the context of data exploration and analysis, for example, you might want to visualize and present data without a tightly choreographed story. Such a visualization would allow the user to navigate and explore the data him/herself, and thereby create new, previously unknown stories. In that way, big data becomes a ‘story space’ in which a multiplicity of stories can reside.
Thanks to Mike and the rest of the GameChangers for an extraordinary event filled with stories to remember!
Fulbright project: Dynamic Information Visualization
As a visiting Fulbright scholar at USC in Los Angeles, I am going to explore the potential of interactive and animated information visualization.
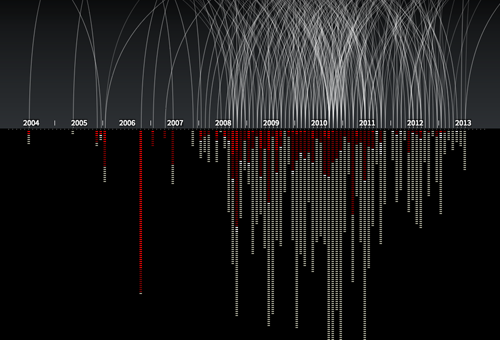
An example of an animated and interactive data visualization, showing every known drone strike in Pakistan, and number of victims. By Pitch Interctive. See http://drones.pitchinteractive.com
It is widely acknowledged that visual representation of information can be highly effective in presenting complex data. Graphical presentation of information enables users to compare data and discover trends, patterns and differences that otherwise would be inaccessible or hard to recognize. However, there has not been much research on interactive data visualization from a design perspective. These are some of the questions I am interested in:
- How may designers approach and work with complex data?
- How may designers understand and handle the tension between data/exploration and narrative/story in dynamic infoviz?
- How can we understand these visualizations as not just ‘neutral presentations of data’, but as meaningful and persuasive design objects?
- How may data visualization move beyond flat, two-dimensional screen displays?
So, what am I going to do?
The project is fairly open ended in terms of deliverables. The plan is to carry out several design experiments with real data, and document and analyze the result. For inspiration, I find it interesting to look to science fiction movies, as they often present novel interfaces for data visualization (even though many of them would not work well as tools for data exploration). What would happen if we used AR or holograms for data visualization?
An additional aim is to enhance my programming skills, which will be necessary for working directly with the material at hand (interaction with data), and for creating working prototypes. So I suppose I will spend quite some time at Codeacademy. Further, I will use gigamapping as a technique for understanding and working with complex data.
I am currently in the process of discussing opportunities for collaborative projects at USC. In addition, I have already an agreement with Difi (The Norwegian Agency for Public Management and eGovernment) to work with data from their large Citizen Survey (Innbyggerundersøkelsen). More on that later.
I am also open for other cases, so feel free to contact me or suggest data that you think should be presented to the world in a visual and engaging form!
Visiting Fulbright scholar at USC in Los Angeles
Better late than never, right? It’s about time to resuscitate this blog and give the interweb an update on my whereabouts!
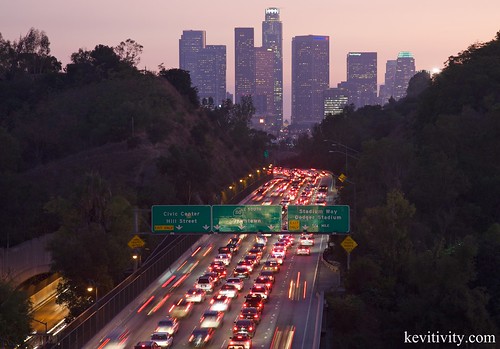
I have recently arrived in Los Angeles, where I will be a visiting Fulbright scholar for 6 months. I will stay at the USC School of Cinematic Arts, doing research on dynamic and interactive data visualization. The research visit is made possible by a research grant from Fulbright Norway. In addition, I will work part time for my Norwegian employer, Halogen.
Why Los Angeles and USC?
It shouldn’t come as a surprise that California is the place to be when it comes to digital innovation as well as moving images, and the sweet spot is to be found at USC. The School of Cinematic Arts is considered the top film school in the US. However, they are not only making films there; the new Interactive Media Building is filled with state of the art technology, such as large multi-touch screens, Oculus Rift virtual reality headsets, and the Oblong g-speak system (you know, the one Tom Cruise uses in Minority Report).
Media Arts + Practice program
I will primarily be working with Virginia Kuhn in the Media Arts + Practice program, which is:
…devoted to exploring the potentials of scholarly expression, visual storytelling, data visualization and social media, including business, education, medicine, urban planning and law, areas in which the ability to use media to communicate effectively is increasingly essential.
This is spot on to my own interests, and more specifically to the project I will work on, exploring dynamic datavisualization (more on that later). In adition, Virginia Kuhn was one of the first to produce a media-rich, born-digital PhD dissertation in the US. So we also share an interest in exploring new forms of scholarly writing composition and publishing.
I feel extremely privileged to be able to be in such an exciting place! More on the project later.
Search
Recent posts
- SpotTrack: Award for Design Excellence
- VizBox Bergen og årets geogründer
- Fulbright report: six months at the School of Cinematic Arts in Los Angeles
- The VizBox Experiments
- TopoBox: exploring a tangible dataviz platform
- Norway in 3D part I: from DEM to 3D surface
- Using visualization for understanding survey data
- Story kicking big data
- Fulbright project: Dynamic Information Visualization
- Visiting Fulbright scholar at USC in Los Angeles
- (E)motional design paper at DANDE2012
- 3,5 års arbeid på 6 minutt og 40 sekund
- PhD thesis online
- New video: Kinetic Interface Design
- Presentasjon: Skisser utanfor boksen