Los Angeles
Story kicking big data
A couple of days ago I attended an event called That Time a Story Kicked Big Bad Data’s Ass. The event was hosted by GameChangers in the pool (!) of gangster gardener Ron Finley . Lucky for us, there was no water in the pool!
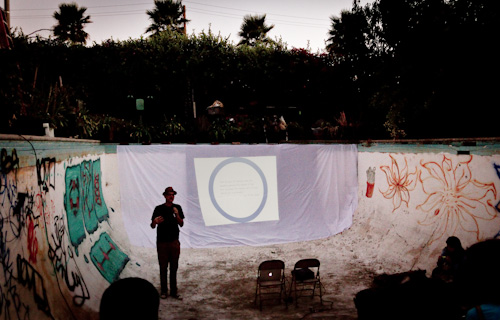
Mike Bonifer in Ron Finley’s pool
GameChangers is a consultancy company that use improvisation techniques and narrative design to help their clients improve their communication and develop brand strategies. Consequently, the event itself was filled with stories and improvisation, which was refreshing.
Infobesity – The Tyranni of Data
The topic of the night was the relationship between big data and stories. Even though it was made clear that we should embrace big data, the take home message was that we need stories to understand and communicate data, and that stories can achieve much that data can’t. The proliferation of big data and lack of stories results in ‘infobesity’.
Mike Bonifer pointed out that stories can create a vision for the future, while data can only show us a snapshot of the past. Stories are experienced in the present, and speak to our unconsciousness. Relating this to my own project, this inspires me to look for ways of integrating data visualization and stories on multiple levels: from visualizing stories, to stories of visualization.
The Tyranny of Stories
However, stories also have a darker side, which Mike referred to as ‘The tyranny of storiesâ€. People can be persuaded to buy into a story based on false premises, like signing up for a subprime mortgage, or to invade a country based on factual lies. Consequently, the power of stories makes them suitable for misuse, just like data and statistics can easily be misused.
Data visualization as a story space
Comparing big data with stories is, of course, somehow like comparing apples and oranges. I agree that data needs a story if you want to communicate something specific. However, in the context of data exploration and analysis, for example, you might want to visualize and present data without a tightly choreographed story. Such a visualization would allow the user to navigate and explore the data him/herself, and thereby create new, previously unknown stories. In that way, big data becomes a ‘story space’ in which a multiplicity of stories can reside.
Thanks to Mike and the rest of the GameChangers for an extraordinary event filled with stories to remember!
Visiting Fulbright scholar at USC in Los Angeles
Better late than never, right? It’s about time to resuscitate this blog and give the interweb an update on my whereabouts!
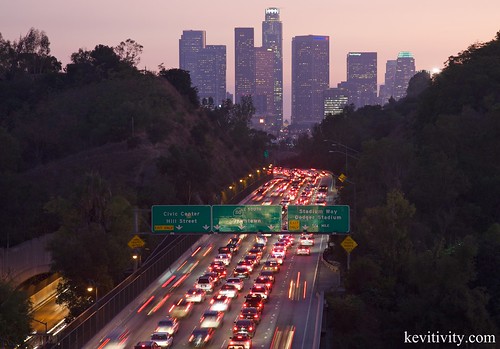
I have recently arrived in Los Angeles, where I will be a visiting Fulbright scholar for 6 months. I will stay at the USC School of Cinematic Arts, doing research on dynamic and interactive data visualization. The research visit is made possible by a research grant from Fulbright Norway. In addition, I will work part time for my Norwegian employer, Halogen.
Why Los Angeles and USC?
It shouldn’t come as a surprise that California is the place to be when it comes to digital innovation as well as moving images, and the sweet spot is to be found at USC. The School of Cinematic Arts is considered the top film school in the US. However, they are not only making films there; the new Interactive Media Building is filled with state of the art technology, such as large multi-touch screens, Oculus Rift virtual reality headsets, and the Oblong g-speak system (you know, the one Tom Cruise uses in Minority Report).
Media Arts + Practice program
I will primarily be working with Virginia Kuhn in the Media Arts + Practice program, which is:
…devoted to exploring the potentials of scholarly expression, visual storytelling, data visualization and social media, including business, education, medicine, urban planning and law, areas in which the ability to use media to communicate effectively is increasingly essential.
This is spot on to my own interests, and more specifically to the project I will work on, exploring dynamic datavisualization (more on that later). In adition, Virginia Kuhn was one of the first to produce a media-rich, born-digital PhD dissertation in the US. So we also share an interest in exploring new forms of scholarly writing composition and publishing.
I feel extremely privileged to be able to be in such an exciting place! More on the project later.
Search
Recent posts
- SpotTrack: Award for Design Excellence
- VizBox Bergen og årets geogründer
- Fulbright report: six months at the School of Cinematic Arts in Los Angeles
- The VizBox Experiments
- TopoBox: exploring a tangible dataviz platform
- Norway in 3D part I: from DEM to 3D surface
- Using visualization for understanding survey data
- Story kicking big data
- Fulbright project: Dynamic Information Visualization
- Visiting Fulbright scholar at USC in Los Angeles
- (E)motional design paper at DANDE2012
- 3,5 års arbeid på 6 minutt og 40 sekund
- PhD thesis online
- New video: Kinetic Interface Design
- Presentasjon: Skisser utanfor boksen