Design and research
Fulbright project: Dynamic Information Visualization
As a visiting Fulbright scholar at USC in Los Angeles, I am going to explore the potential of interactive and animated information visualization.
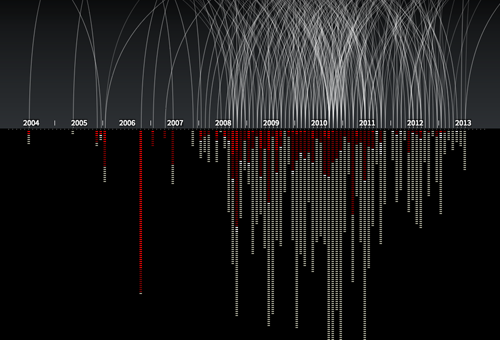
An example of an animated and interactive data visualization, showing every known drone strike in Pakistan, and number of victims. By Pitch Interctive. See http://drones.pitchinteractive.com
It is widely acknowledged that visual representation of information can be highly effective in presenting complex data. Graphical presentation of information enables users to compare data and discover trends, patterns and differences that otherwise would be inaccessible or hard to recognize. However, there has not been much research on interactive data visualization from a design perspective. These are some of the questions I am interested in:
- How may designers approach and work with complex data?
- How may designers understand and handle the tension between data/exploration and narrative/story in dynamic infoviz?
- How can we understand these visualizations as not just ‘neutral presentations of data’, but as meaningful and persuasive design objects?
- How may data visualization move beyond flat, two-dimensional screen displays?
So, what am I going to do?
The project is fairly open ended in terms of deliverables. The plan is to carry out several design experiments with real data, and document and analyze the result. For inspiration, I find it interesting to look to science fiction movies, as they often present novel interfaces for data visualization (even though many of them would not work well as tools for data exploration). What would happen if we used AR or holograms for data visualization?
An additional aim is to enhance my programming skills, which will be necessary for working directly with the material at hand (interaction with data), and for creating working prototypes. So I suppose I will spend quite some time at Codeacademy. Further, I will use gigamapping as a technique for understanding and working with complex data.
I am currently in the process of discussing opportunities for collaborative projects at USC. In addition, I have already an agreement with Difi (The Norwegian Agency for Public Management and eGovernment) to work with data from their large Citizen Survey (Innbyggerundersøkelsen). More on that later.
I am also open for other cases, so feel free to contact me or suggest data that you think should be presented to the world in a visual and engaging form!
Visiting Fulbright scholar at USC in Los Angeles
Better late than never, right? It’s about time to resuscitate this blog and give the interweb an update on my whereabouts!
I have recently arrived in Los Angeles, where I will be a visiting Fulbright scholar for 6 months. I will stay at the USC School of Cinematic Arts, doing research on dynamic and interactive data visualization. The research visit is made possible by a research grant from Fulbright Norway. In addition, I will work part time for my Norwegian employer, Halogen.
Why Los Angeles and USC?
It shouldn’t come as a surprise that California is the place to be when it comes to digital innovation as well as moving images, and the sweet spot is to be found at USC. The School of Cinematic Arts is considered the top film school in the US. However, they are not only making films there; the new Interactive Media Building is filled with state of the art technology, such as large multi-touch screens, Oculus Rift virtual reality headsets, and the Oblong g-speak system (you know, the one Tom Cruise uses in Minority Report).
Media Arts + Practice program
I will primarily be working with Virginia Kuhn in the Media Arts + Practice program, which is:
…devoted to exploring the potentials of scholarly expression, visual storytelling, data visualization and social media, including business, education, medicine, urban planning and law, areas in which the ability to use media to communicate effectively is increasingly essential.
This is spot on to my own interests, and more specifically to the project I will work on, exploring dynamic datavisualization (more on that later). In adition, Virginia Kuhn was one of the first to produce a media-rich, born-digital PhD dissertation in the US. So we also share an interest in exploring new forms of scholarly writing composition and publishing.
I feel extremely privileged to be able to be in such an exciting place! More on the project later.
(E)motional design paper at DANDE2012
Last week I presented my paper on (E)motional design at Out of Control, the 8th International Design & Emotion Conference in London. With the paper, I argue that movement and emotion are highly interconnected, and that movement has the power to affect, engage and persuade us deeply.
The presentation was of course made with Prezi, using the new 3D background feature. Feel free to click through it:
In order to analyse and design kinetic interfaces (interfaces characterized by movement) we need to consider two things at the same time: how movement helps us to carry out actions, and how movement creates meaning (=double mediation). The paper includes an analysis of how movement is used on the screen interface of the Apple iPad, as well as a design experiment in which I used stop motion animation to explore how movement can be used in a mobile app.
Ready for some academic arguments about visual movement? Have a look at the paper: (E)motional design: double mediation in kinetic interfaces.
PS 1: the paper is based on the trial lecture I held for my PhD defence in 2010.
PS 2: download the magazine app I use as an example of a kinetic interface: Katachi.
PhD thesis online
The public defence of my PhD thesis took place at AHO, December 22. The thesis, entitled Navimation: a sociocultural exploration of kinetic interface design is now available online, through AHO’s open access archive ADORA.
The thesis consists of a metareflection (kappe) and three publications. All publications have gone through peer-review and have been published before. The metareflection situates and extends these publications by providing more theoretical background and introducing new concepts and models.
Download the documents below:
Metareflection
 Eikenes, J.O.(2010). Navimation: a sociocultural exploration of kinetic interface design. Doctoral thesis, Oslo School of Architecture and Design, Institute of Design, Oslo. Eikenes, J.O.(2010). Navimation: a sociocultural exploration of kinetic interface design. Doctoral thesis, Oslo School of Architecture and Design, Institute of Design, Oslo.
|
Publication 1
 Eikenes, J.O. and A. Morrison (2010). Navimation: Exploring time, space & motion in the design of screen-based interfaces. International Journal of Design, 4(1), 1-16. Eikenes, J.O. and A. Morrison (2010). Navimation: Exploring time, space & motion in the design of screen-based interfaces. International Journal of Design, 4(1), 1-16.
Also available from The International Journal of Design.. |
Publication 2
 Eikenes, J. O. (2009). Social navimation: Engaging interfaces in social media. Paper presented at Engaging Artifacts. The 3rd Nordic design research conference (NORDES). 31 August-1 September. Eikenes, J. O. (2009). Social navimation: Engaging interfaces in social media. Paper presented at Engaging Artifacts. The 3rd Nordic design research conference (NORDES). 31 August-1 September.
Download Publication 2 (0,6 MB) Also available from NORDES. |
Publication 3
 Eikenes, J.O.(2010). Connecting motional form to interface actions in web browsing: Investigating through motion sketching. FORMakademisk, 3(1), 80-100. Eikenes, J.O.(2010). Connecting motional form to interface actions in web browsing: Investigating through motion sketching. FORMakademisk, 3(1), 80-100.
Download Publication 3 (1,4 MB) Also available from FORMakademisk. I have also created an online version with embedded videos. |
New video: Kinetic Interface Design
In order to make my research more accessible I have created a video that shows a number of kinetic interfaces. Kinetic interfaces are here understood as screen-based interfaces that are characterized by movement.
Kinetic Interface Design from JonO on Vimeo.
In addition to the interface examples, a number of descriptive and analytical terms are presented. These terms have been developed through analysis of kinetic interfaces in academic publications. The kinetic interfaces presented in the video are:
The Apple OSX login box
NAVIMATION
The Iconist #1 (iPad)
www.leoburnett.ca
Disney Movies (iPad)
SOCIAL NAVIMATION
www.taggraph.com
Flipboard (iPad)
MOTIONAL TRANSFORMATION
www.jonathanyuen.com
www.well-formed-data.net/experiments/elastic_lists
SPATIAL MANIPULATION
For All Seasons (iPhone)
www.tryggtrafikk.no/Sykkelhjelm2010
www.ecodazoo.com
TEMPORAL NAVIGATION
Cooliris (iPhone)
www.wrangler-europe.com/bluebell/ss10/#/collection
www.flashloaded.com/flashcomponents/3dwall
INDEXICAL COMPOSITING
www.sectionseven.com/index2.html
www.homeinvest.no
VIRTUAL KINETICS
www.thewhalehunt.org
www.thibaud.be
Music: ‘Rieth’ from Gesamtlaufzeit by Marko Fürstenberg. (Used with permission.)
Search
Recent posts
- SpotTrack: Award for Design Excellence
- VizBox Bergen og årets geogründer
- Fulbright report: six months at the School of Cinematic Arts in Los Angeles
- The VizBox Experiments
- TopoBox: exploring a tangible dataviz platform
- Norway in 3D part I: from DEM to 3D surface
- Using visualization for understanding survey data
- Story kicking big data
- Fulbright project: Dynamic Information Visualization
- Visiting Fulbright scholar at USC in Los Angeles
- (E)motional design paper at DANDE2012
- 3,5 års arbeid på 6 minutt og 40 sekund
- PhD thesis online
- New video: Kinetic Interface Design
- Presentasjon: Skisser utanfor boksen