Fulbright
Fulbright report: six months at the School of Cinematic Arts in Los Angeles
As an interaction designer and researcher, I have always been fascinated by the power of visual communication and moving images in particular. Therefore, I was thrilled when I got invited to visit the School of Cinematic Arts at USC in Los Angeles for six months in 2013-2014. So, what happens when you put an introvert Norwegian in Los Angeles for half a year?

From Hollywood celebrities to traffic jam
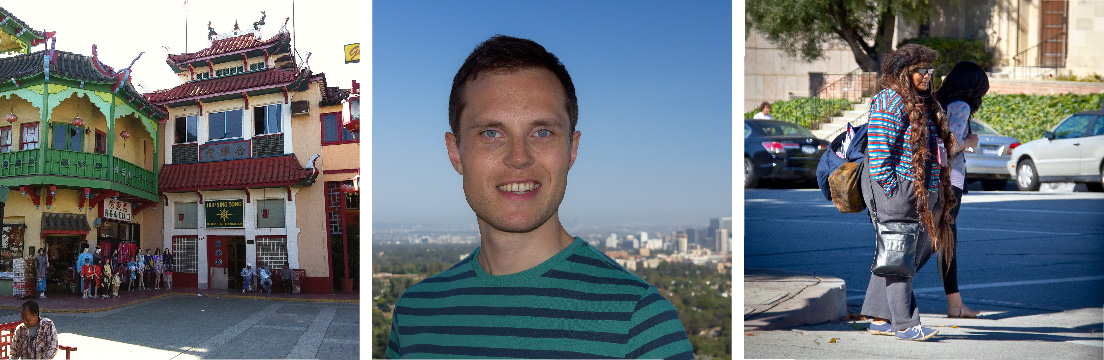
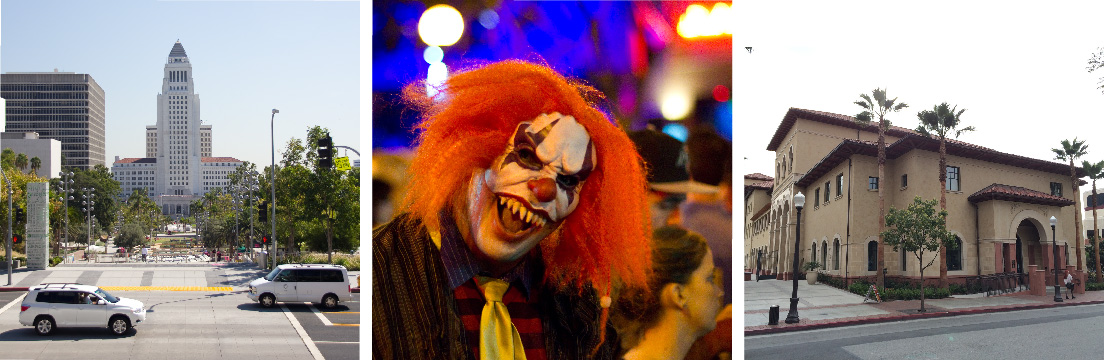
For Norwegians, Los Angeles is probably most known for Hollywood movies and celebrities, in addition to beautiful beaches and palm trees. However, Los Angeles is extremely diverse. As one of the locals expressed it, Los Angeles is more like a salad bowl than a melting pot: different cultures and traditions exist alongside each others in stead of blending together. From Korea town to Bevery Hills, Downtown to Santa Monica – these are all sub-cities that apparently exist completely independent of each other.
Another obvious aspects that characterizes LA, is its car culture. It seems like everyone you talk to in LA have a car, and spend 1-3 hours each day just to get between home and work. Only one person in each car, of course! The traffic is overwhelming. For this reason, the first impression of the city can be quite harsh, but as you start to know different areas and spots in the city, it’s hard not to fall in love with it.
Introverts in LA
I was traveling to the US together with my husband, who was visiting UCLA as part of his PhD studies in cell biology. We both consider ourselves introverts, and consequently we were slightly anxious about how we would fit in, considering that LA is known for its outgoing and extrovert culture.
However, we quickly learned to appreciate the small talk in the shops, colleagues introducing us to their coworkers, and the including atmosphere in general. (And by the way, there are introvert people in LA as well, believe it or not!).
In addition, we were lucky to make friends with some of the locals quite early on, who brought us to cosy restaurants, beautiful hiking trails and intriguing exhibitions, and included us in American traditions such as Thanksgiving.
It’s all about the story
If I have to choose one word that summarizes the professional insight I gained in LA, it is the word ‘storytelling’. Everywhere you go in LA, from cafés to offices, from parties to academic seminars, people are talking about storytelling, as well as enacting it.
Considering that 120 000 people are employed in the entertainment industry in LA, this might not come as a big surprise. However, storytelling is not necessarily about creating the next Hollywood blockbuster; it might as well be used as a tool for creating engaging real world experiences or stimulating social change. If you have ever been to Disneyland, you know what I am talking about: everything is planned, staged and choreographed from beginning to end.
Storytelling is about telling an audience or reader how something happened to someone through a series of events. There is often some sort of conflict in the story, something that craves our attention. As a result, people are engaged and able to relate to what you have to say. Some researchers even claim that our brains are ‘hardwired’ for stories. Through storytelling, we can not only entertain people, we can also convey information and explain complex issues. Is seems to me that academics and researchers in particular have much to learn from storytellers.
Visiting the School of Cinematic Arts
The School of Cinematic Arts at USC is often ranked as the top educational institution for movie makers in the world. However, the teaching and research at the school deals with all kinds of ‘world building’ beyond movies, including computer games and other forms of interactive experiences across various media platforms.
The faculty at the school are hard working, teaching as well as doing research. It was striking to discover how many of the teaching staff combine their job at the university with entrepreneurial work such as consulting, movie making, running a shop, or starting a new business. The American Dream is very much alive, obviously generating a lot of creativity, knowledge and value. For example, one of the highlights of our stay in LA was an event at the bottom of an empty swimming pool, hosted by a company started by one of my colleagues at USC.
Data visualization and 3D printing
The aim of my research at USC was to explore interactive data visualization. During my stay I participated in several classes as well as research projects. The main outcome of my stay was a physical platform for interactive data visualization, which I called the ‘VizBox’. The VizBox combines 3D printing, projection mapping and gesture interaction. In order to document and convey the potential of such a platform, I created a video that demonstrates some of its possibilities.
Home, sweet home
Back in Norway, I am filled with gratitude for everything I got to experience in the US, and the friends I have made along the way. But being away from Norway for so long also made me appreciate how everyone in Norway have more or less equal opportunities – be if for education, healthcare or marriage. This is something we tend to take for granted. So be it that we might not be as good at storytelling, small talk and entrepreneurship as the angelenos.
The VizBox Experiments
This is the result of a project I have been working on for the past months. The video demonstrates the setup and use of the VizBox (previously known as TopoBox) – a physical platform for interactive data visualization on three-dimensional surfaces.
The project has been highly explorative, geared towards testing and demonstrating new potentials rather than producing a finished product ready for use. Hopefully, this can serve as a starting point for new discussions, projects and experiments.
I do not currently have any specific plans for developing the VizBox further. However, I would be happy to discuss ideas and possibilities for collaboration. What would YOU do if you had a box like this?
Update march 2015: I have made a new prototype and video, and won a prize for the work! See the new blogpost: “VizBox Bergen og Ã¥rets geogründer” (in Norwegian).
Credits
- Funding from Fulbright
- Elevation data and geographic data from The Norwegian Mapping authorities
- Norwegian municipalities in GeoJSON by Ove Daae Lampe
- Statistical data from Statistics Norway
- Survey data from Difi
- Music: All Night by Sliptide
- Made with Processing and the Unfolding Maps and LeapMotionP5 libraries.
Special thanks to colleagues and students in the Media Arts + Practice program within the School of Cinematic Arts – especially Virginia Kuhn, Andreas Kratky and Behnaz Farahi.
Fulbright project: Dynamic Information Visualization
As a visiting Fulbright scholar at USC in Los Angeles, I am going to explore the potential of interactive and animated information visualization.
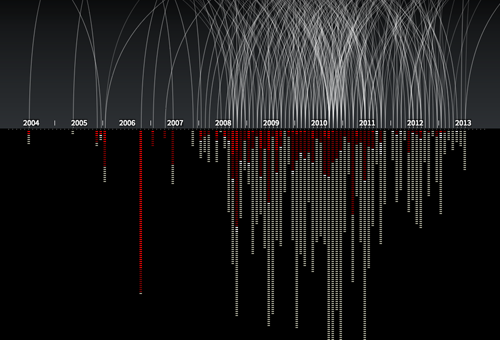
An example of an animated and interactive data visualization, showing every known drone strike in Pakistan, and number of victims. By Pitch Interctive. See http://drones.pitchinteractive.com
It is widely acknowledged that visual representation of information can be highly effective in presenting complex data. Graphical presentation of information enables users to compare data and discover trends, patterns and differences that otherwise would be inaccessible or hard to recognize. However, there has not been much research on interactive data visualization from a design perspective. These are some of the questions I am interested in:
- How may designers approach and work with complex data?
- How may designers understand and handle the tension between data/exploration and narrative/story in dynamic infoviz?
- How can we understand these visualizations as not just ‘neutral presentations of data’, but as meaningful and persuasive design objects?
- How may data visualization move beyond flat, two-dimensional screen displays?
So, what am I going to do?
The project is fairly open ended in terms of deliverables. The plan is to carry out several design experiments with real data, and document and analyze the result. For inspiration, I find it interesting to look to science fiction movies, as they often present novel interfaces for data visualization (even though many of them would not work well as tools for data exploration). What would happen if we used AR or holograms for data visualization?
An additional aim is to enhance my programming skills, which will be necessary for working directly with the material at hand (interaction with data), and for creating working prototypes. So I suppose I will spend quite some time at Codeacademy. Further, I will use gigamapping as a technique for understanding and working with complex data.
I am currently in the process of discussing opportunities for collaborative projects at USC. In addition, I have already an agreement with Difi (The Norwegian Agency for Public Management and eGovernment) to work with data from their large Citizen Survey (Innbyggerundersøkelsen). More on that later.
I am also open for other cases, so feel free to contact me or suggest data that you think should be presented to the world in a visual and engaging form!
Visiting Fulbright scholar at USC in Los Angeles
Better late than never, right? It’s about time to resuscitate this blog and give the interweb an update on my whereabouts!

I have recently arrived in Los Angeles, where I will be a visiting Fulbright scholar for 6 months. I will stay at the USC School of Cinematic Arts, doing research on dynamic and interactive data visualization. The research visit is made possible by a research grant from Fulbright Norway. In addition, I will work part time for my Norwegian employer, Halogen.
Why Los Angeles and USC?
It shouldn’t come as a surprise that California is the place to be when it comes to digital innovation as well as moving images, and the sweet spot is to be found at USC. The School of Cinematic Arts is considered the top film school in the US. However, they are not only making films there; the new Interactive Media Building is filled with state of the art technology, such as large multi-touch screens, Oculus Rift virtual reality headsets, and the Oblong g-speak system (you know, the one Tom Cruise uses in Minority Report).
Media Arts + Practice program
I will primarily be working with Virginia Kuhn in the Media Arts + Practice program, which is:
…devoted to exploring the potentials of scholarly expression, visual storytelling, data visualization and social media, including business, education, medicine, urban planning and law, areas in which the ability to use media to communicate effectively is increasingly essential.
This is spot on to my own interests, and more specifically to the project I will work on, exploring dynamic datavisualization (more on that later). In adition, Virginia Kuhn was one of the first to produce a media-rich, born-digital PhD dissertation in the US. So we also share an interest in exploring new forms of scholarly writing composition and publishing.
I feel extremely privileged to be able to be in such an exciting place! More on the project later.
Search
Recent posts
- SpotTrack: Award for Design Excellence
- VizBox Bergen og årets geogründer
- Fulbright report: six months at the School of Cinematic Arts in Los Angeles
- The VizBox Experiments
- TopoBox: exploring a tangible dataviz platform
- Norway in 3D part I: from DEM to 3D surface
- Using visualization for understanding survey data
- Story kicking big data
- Fulbright project: Dynamic Information Visualization
- Visiting Fulbright scholar at USC in Los Angeles
- (E)motional design paper at DANDE2012
- 3,5 års arbeid på 6 minutt og 40 sekund
- PhD thesis online
- New video: Kinetic Interface Design
- Presentasjon: Skisser utanfor boksen