3D
VizBox Bergen og årets geogründer
Geomatikkdagene 2015 gjekk av stabelen 17.-19. mars på Lillehammer. Geomatikk handlar om å kombinere tradisjonelle kartfag med informasjonsteknologi, som inkluderer alt frå oppmåling og datainnsamling til presentasjon av data på kart.
Fem geogründerar var inviterte til konferansen for Ã¥ presentere prosjekta sine, og eg presenterte eksperimenta eg har gjort med projisering av grafikk på 3D-printa terrengmodellar. Det var mange spennande prosjekt, men etter avstemminga var eg den heldige som vart kÃ¥ra til ‘Ã¥rets geogründer’! Hurra!
The VizBox Experiments
Eg presenterte både nye og gamle eksperiment. Under kan du sjå dei første eksperimenta, der eg tok utgangspunkt i eit 3D-printa kart over Sør-Noreg og bygningskomplekset til School of Cinematic Arts i Los Angeles:
VizBox Bergen
I tillegg presenterte eg nokre nye eksperiment der eg har tatt utgangspunkt i Bergen by og omegn:
I tillegg til heder og ære var premien Ã¥ fÃ¥ delta gratis pÃ¥ Geomatikkdagene 2017 – og det gledar eg meg til!
The VizBox Experiments
This is the result of a project I have been working on for the past months. The video demonstrates the setup and use of the VizBox (previously known as TopoBox) – a physical platform for interactive data visualization on three-dimensional surfaces.
The project has been highly explorative, geared towards testing and demonstrating new potentials rather than producing a finished product ready for use. Hopefully, this can serve as a starting point for new discussions, projects and experiments.
I do not currently have any specific plans for developing the VizBox further. However, I would be happy to discuss ideas and possibilities for collaboration. What would YOU do if you had a box like this?
Update march 2015: I have made a new prototype and video, and won a prize for the work! See the new blogpost: “VizBox Bergen og Ã¥rets geogründer” (in Norwegian).
Credits
- Funding from Fulbright
- Elevation data and geographic data from The Norwegian Mapping authorities
- Norwegian municipalities in GeoJSON by Ove Daae Lampe
- Statistical data from Statistics Norway
- Survey data from Difi
- Music: All Night by Sliptide
- Made with Processing and the Unfolding Maps and LeapMotionP5 libraries.
Special thanks to colleagues and students in the Media Arts + Practice program within the School of Cinematic Arts – especially Virginia Kuhn, Andreas Kratky and Behnaz Farahi.
TopoBox: exploring a tangible dataviz platform
A lot of exciting examples of interactive data visualization projects are popping up on the web these days. Many of these are interactive, and allow the user to navigate or filter information using a mouse or a finger on a touch screen. But what might the future of interactive data visualization look like?
Even though touch screens might seem perfect for interacting with computers, they are far from perfect. As pointed out by Bret Victor, our screens force us to interact with pictures under glass, and don’t allow us to make use of our full range of capabilities for perceiving and interacting with tangible objects. After all, we are experts at interacting with real-world objects that have physical properties like texture, translucency, elasticity and weight.
Science fiction movies and holographic displays
If we look to science fiction movies (which often give us a glimpse into possible futures of interface design), it seems like the future is going to be filled with large, immersive holographic displays. Even though many of these envisioned interfaces don’t seem very usable or even useful, there is obviously something immediate and engaging with the presentation of graphics in three-dimensional space, integrated with our physical environment. For example, such interfaces would allow multiple users to see and explore three-dimensional data from multiple angles.
Still image from Avatar. Image: inventinginteractive.com
While there have been a lot of interesting developments in holographic display technology in recent years, for example by the Graphics Lab at the University of Southern California, I believe we have a long way to go before high quality holographic displays will be available outside high tech labs.
Virtual Reality and Augmented Reality are probably more likely to be successful, but they come with a big disadvantage: they provide un-social interfaces. AR and VR typically place the interface in front of users’ faces, thereby obstructing social interaction between the user(s) and other people. In contrast, the holographic displays portrayed in science fiction movies like Avatar are social; they allow multiple users to seamlessly interact with the information and each other.
However, even if holographic displays were cheap and available, they would not provide any haptic feedback and data with material qualities. What if we could find a way to combine haptic interaction with spatial, three-dimensional graphics, and thereby create a new medium for data visualization, using commonly available and affordable technology?
Case: a topographic map of Norway
While I was working with survey data from Difi a while back, I was sketching out different ideas for creating interactive data visualizations using the data from Norway.
One of the ideas that emerged was to build a physical box with a topographic landscape of Norway on top of it, onto which graphics could be projected from inside the box. For practical purposes the graphics could be projected onto a mirror in the box from one of the sides, as shown in the illustration below.
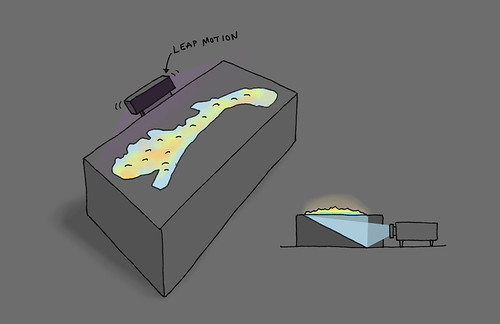
By attaching a Leap Motion sensor to the box, the users would be able to interact with the visualization using gestures, for example pointing to specific places to open more information on an adjacent screen, or make a swipe gesture above the box to go to the next visualization. If rear-projection is used, there will be no shadows from the hands, which often is a problem when front projection is used.
Obviously, this surface does not provide the same flexibility for 3D graphics that a holographic display would do. But for specific applications it might be superior to holographic displays, because of its physical manifestation and tangibility. And more importantly, this platform can be put together using commonly available and fairly cheap technology.
Initial experiments: projection on 3D printed surfaces
3D printing is perfect for creating complex surfaces. However, I wasn’t sure how rear projection would work with the 3D printed material, so I needed to start off by doing some simple experiments. I ordered some sample models with different thickness from Shapeways, including one representing buildings in a cityscape, and projected graphics onto them.
The result wasn’t as good as I hoped for, but not too bad either. I was especially happy to see how effective it is to see movement on a curved, physical object. Kind of magic, don’t you think?
As expected, the quality of the graphic is best using front projection. However, if the surface is thin (less than 1mm), rear projection works quite well, if not for the most detailed graphics.
After much struggle, I also managed to create and print a 3d model of the southern part of Norway:
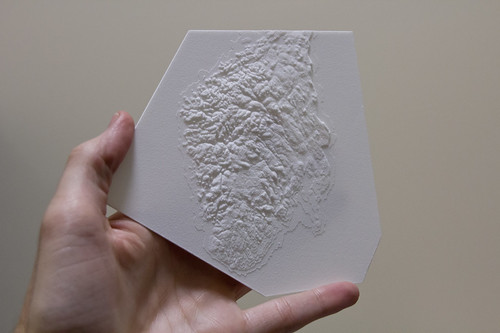
Note that the elevation has been exaggerated. Otherwise, it would probably be impossible to see any fjords or mountains at all. After all, the aim here is not to reproduce a perfect scale model, but rather a physical representation that is as informative as possible.
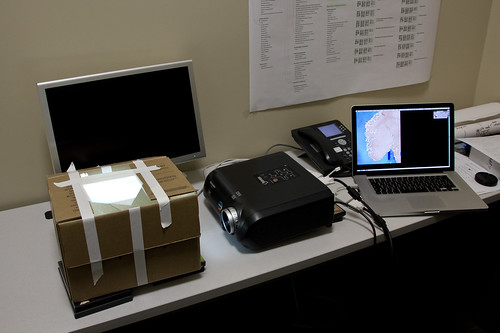
A rough mockup to test the rear projection via a mirror in a box:
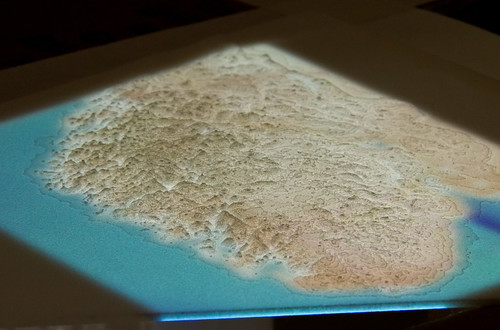
Finally, the result:
Even though I found these experiment promising, it is clear that I need to print a larger model in order to get higher graphical resolution. In addition, I think I need to exaggerate the elevation even more.
Further work and remaining questions
As you probably can guess, this work is highly experimental, including a lot of trial and error. This can be quite frustrating at times, and I am not sure how good result it is possible to get using 3D printing and rear projection.
Probably, this new ‘medium’ will turn out to work well for some types of visualizations, and not for others. What are the design affordances of such a medium? What kind of data would you like to see projected onto such a physical landscape? How would you interact with it?
Norway in 3D part I: from DEM to 3D surface
Earlier this year the Norwegian Mapping Authority released a bunch of free data, including Digital Elevation Model (DEM) files that describe the terrain of Norway in high detail.
I wanted to use this data to create a 3D model of Norway that I eventually could 3D print. This turned out to be a bit complicated, so I want to share some of my experiences in case anyone else wants to do something similar. So yes, this will be a bit technical.
Getting the DEM files
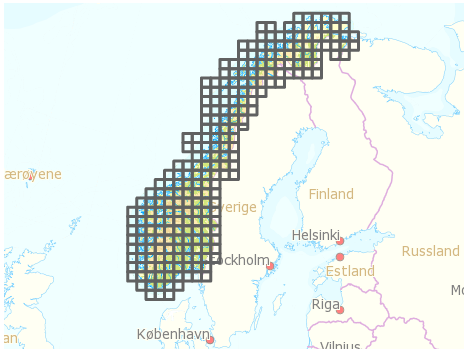
After registering and logging in to data.kartverket.no you are ready to download the files. But don’t think you get one file for the whole of Norway! First, you have to figure out which files to download (I used ‘Digital terrengmodell 10 m , UTM 33’), and then select and download 254 individual files one by one to get all the tiles you need.
Merging the tiles
So, now you have a lot of DEM files that you need to combine into one large file. I installed GDAL, which is an open source and powerful “translator library for raster geospatial data formatsâ€. The library is used by various software packages, and can also be used with shell scripts. After quite a lot of googling and trial and error I managed to write a shell script that combined all the DEM files into one GeoTIFF file. The script:
#!/bin/bash
gdal_merge.py -ps 100 100 -init 255 -o merged.tif *.dem
-ps 100 100 specifies the resolution for the output file. Higher number: smaller output file.
-init 255 specifies color range.
-o merged.tif specifies the output file.
*.dem uses all the DEM files in the current folder as input.
See full gdal_merge documentation for more.
GeoTIFF files are similar to regular TIFF images, but they store a lot of additional geospatial data. You may open the file in Photoshop, but you will probably just see some basic black and white contours.
Create heightmap
One of the simplest ways to create a landscape in 3D is to use a greyscale heightmap, and displace a surface according to the image. A heightmap is basically just an image in which color represents height, from low (black) to high (white). There are probably other more sophisticated ways of creating a 3D surface, but this is at least quite straightforward.
First, it is necessary to create a greyscale heightmap from the GeoTIFF file. This shell script did the trick:
#!/bin/bash
gdal_translate -b 1 -scale -20 2500 -of PNG merged.tif heightmap.png
-b 1 select input band 1 (don’t even ask me).
-scale -20 2500 set height/color range from -20 m (black) to 2500 m (white).
-of PNG specify output file format.
merged.tif input filename.
heightmap.png output filename.
See full gdal_translate documentation
The result is a greyscale map that looks like this:
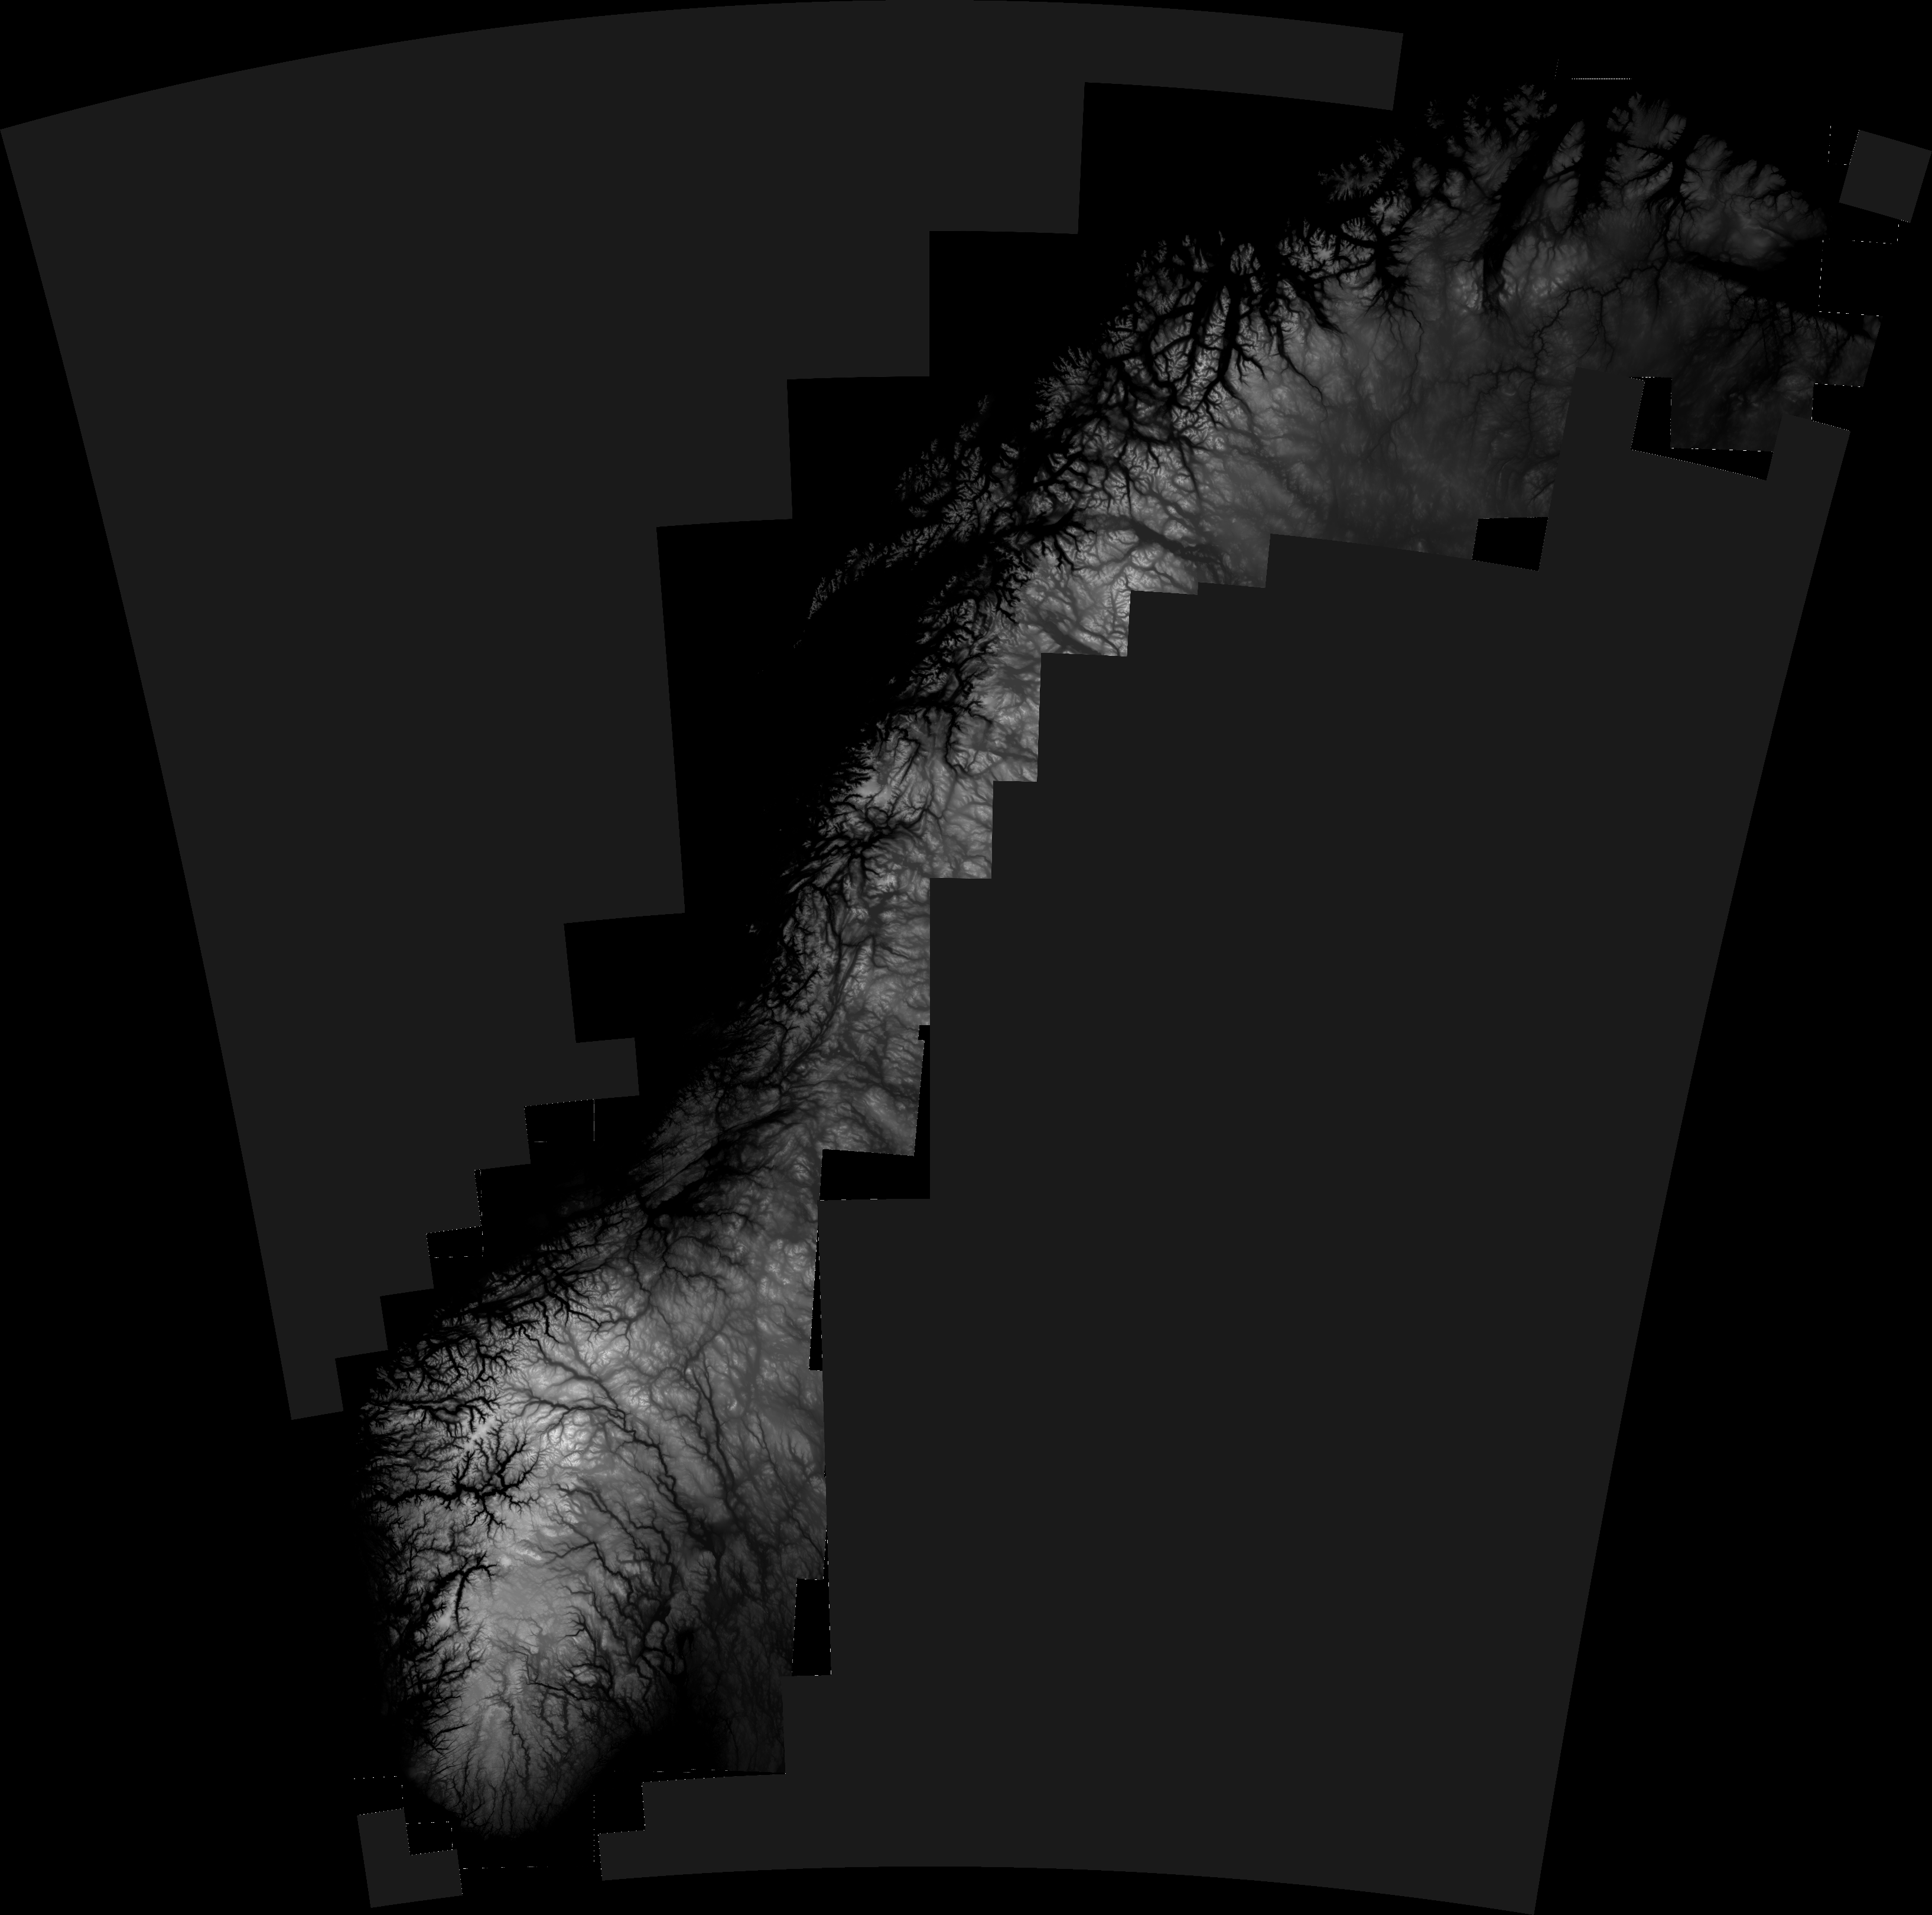
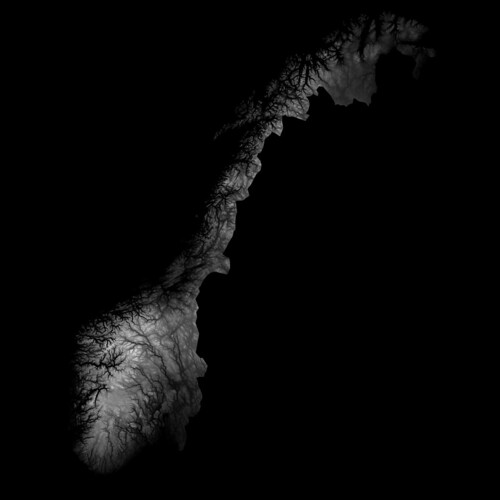
As you may see, parts of Sweeden have been included in this image. We can’t have that, of course, so I removed the Sweedish areas by applying a mask in Photoshop. Here is the final heightmap (click to see larger version on Flickr):
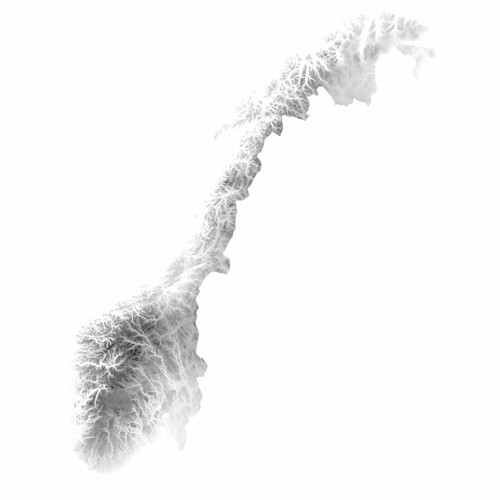
By the way, it looks even cooler with inverted colors, don’t you think? The fjords and the mountains look like veins in some kind of alien organism..
Create 3D surface in Blender
A lot of 3D applications can create 3D surfaces from heightmaps. Since I am trying to use open source software as much as I can, I wanted to use Blender, and for this purpose it worked quite well. (The capabilities of Blender are impressive, but is unfortunately quite hard to use due to a range of usability issues, even though they did a major UI facelift a couple of years ago.)
Creating a 3D surface from a heightmap goes something like this:
- Create a plane
- Go to edit mode (Tab), and subdivide the plane (W). More subdivisions will give you more detail, but also a very heavy model.
- Go back to object mode, add new material to the plane
- Add new texture to the place, and select “Image or movie†as input. Load the heightmap image
- Add a Displacement modifier to the plane, using the texture as input. Adjust the strength to adjust how much the surface should be displaced
And voilà ! You have Norway as a 3D surface. Add some light, and you get something like this:
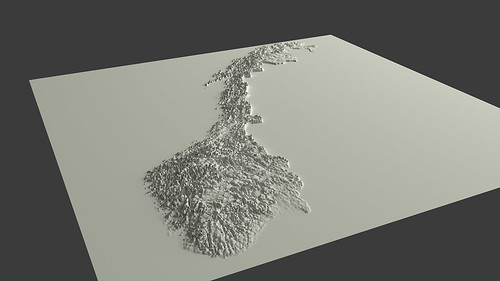
You can probably see that I have exaggerated the height a lot in this particular model. Otherwise it would probably be hard to see any landscape at all.
Actually, when I look at it, I find this to be an interesting visualization in itself; by exaggerating the height, it is possible to get an impression of the topography of different areas of Norway in one picture, which otherwise would be impossible to achieve.
Wouldn’t it be cool to 3D print this? Oh yes, I’ll get back to that. And why I wish the earth was flat.
Search
Recent posts
- SpotTrack: Award for Design Excellence
- VizBox Bergen og årets geogründer
- Fulbright report: six months at the School of Cinematic Arts in Los Angeles
- The VizBox Experiments
- TopoBox: exploring a tangible dataviz platform
- Norway in 3D part I: from DEM to 3D surface
- Using visualization for understanding survey data
- Story kicking big data
- Fulbright project: Dynamic Information Visualization
- Visiting Fulbright scholar at USC in Los Angeles
- (E)motional design paper at DANDE2012
- 3,5 års arbeid på 6 minutt og 40 sekund
- PhD thesis online
- New video: Kinetic Interface Design
- Presentasjon: Skisser utanfor boksen